Author: Sergey Roussakow, MD, PhD (0000-0002-2548-895X)
This blog reconsiders the traditional point of view about the training effect and physiological mechanisms of easy running and low heart rate training.
The Miracle of Long Slow Distance
If you ask a novice runner what the benefits of long slow distance running (LSD) (also known as low-heart rate running or easy running) are, you may hear them say “heart training.” If you then ask how this happens, they may explain to you that the heart stroke volume representing the “heartbeat strength” peaks at a low heart rate of only about 100 bpm and then practically does not increase, so “fairly easy running is a good developer of the heart muscle, and although it doesn’t feel as if you are working very hard, your heart is” [1]. Thus, there is no point in further increasing the load, because one can benefit from this training effect without extra effort, and you can literally “race faster by training slower” [2]. That’s why you always hear from LSD and 80/20 adherents something like “It’s (more like) a ninety-minute social hour” when we “just run side by side at a relaxed pace and carry on a conversation” [2]. It sounds great and attracts many newcomers every year, but is it true?
Actually, I respect attempts to cheat the laws of nature. This is creativity, and I would be delighted if someone finally created a perpetual motion machine. But until this happens, I remain a rationalist and consider it my duty to explain that there’s no such thing as a free lunch and “effortless training”, and the laws of thermodynamics cannot be deceived.
Where did this come from?
Where did the idea of low heart rate training come from? It seems that it was first voiced by Woldemar Gerschler in the late 1930s. This famous inventor of interval training, at least in the early stages of development of this concept, attributed the training effect mainly to intervals, that is, the recovery periods between high-intensity sessions when the heart contracts at “maximum stroke volume.” And it really worked… in combination with submaximal load. Arthur Lydiard certainly played the main role in popularizing the idea of LSD, or rather, he is considered its father, although in fact the Lydiard system was more of a type of fartlek with increased LSD mileage. However, in the 70s, it was the idea of “effortless training” that was popularized as the essence of the Lydiard system and gave birth to the “running boom” of the 70s in the United States. It was a brilliant marketing ploy. Selling the idea of training hard to the masses is difficult, but the idea of “effortless running” certainly caught on. As Jim Fixx, one of the fathers of the American “running revolution”, wrote in his bestseller The Complete Book of Running, “If you feel that you’re running, no matter how slow you’re going, no one can say you’re not” [3]. The idea of “easy running at maximum stroke volume” had taken root in sports physiology [1].
What really happens?
Everything old is new again. In fact, the stroke volume response to exercise was described exhaustively by Robert Rushmer [4, 5] back in the late 50s (Fig. 1).
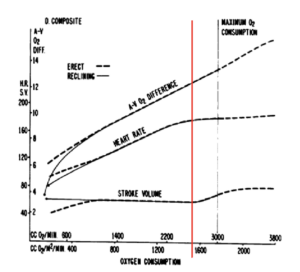
Fig. 1. Dynamics of the components of cardiac output at rest and during exercise (dashed line – in an upright position, solid line – in recumbent position, red line – trend transition point) [5].
In the recumbent position, when venous return is almost not limited by gravity, the heart chambers fill quickly and stretch to their maximum, so the stroke volume peaks thanks to the Frank-Starling law, a type of the so-called myotatic reflex that works at the level of muscle fiber. The Frank-Starling mechanism consists of two components: (1) active contraction is activated by the compression of muscle mechanoreceptors when a muscle is stretched, and (2) passive response is determined by the fact that the muscle fiber, when stretched, accumulates elastic energy, and the more it is stretched, the stronger it contracts. This phenomenon is known as residual eccentric force. In general, it’s like with a balloon: the more you inflate, the stronger the air flow. It is important to understand that this does not “train” the balloon, which is simply working within its natural range.
In an upright position (standing or sitting), gravity limits venous return. The volume of blood in the venous part of the systemic circulation is about 80% of the circulating blood volume, while the arterial part accounts for only 12-15%, and the capillaries for the resting 5-8%, but in an upright position, the venous blood is additionally redistributed to the veins of the lower extremities and abdominal cavity, which decreases the filling of the heart chambers and, according to Starling’s law, decreases the force of contraction, stroke volume and cardiac output. The magnitude of the decrease in stroke volume varies greatly from study to study, but on average it can be estimated at 10-30%. Already with minor physical activity of <60% V̇O2max, that is, with a heart rate of 100-110 bpm, stroke volume is restored to the maximum value observed in the recumbent position [5, 6]. The main mechanism in this case is an increase in sympathetic tone, which leads to contraction of the veins and an increase in venous return. It is often overlooked that the venous bed has 3-4 times more abundant sympathetic innervation than the arterial bed, so an increase in venous tone is no less, if not a more significant component of the sympathetic effect.
The low-heart rate increase in stroke volume is thus restorative and reflex, i.e. not associated with increased myocardial contractility. In other words, based on this, the idea of maximum stroke volume-based low-heart rate training is untenable: you can just as well “train lying down”, since the recumbent stroke volume is the same as at the low-heart rate training, and the effort is much less. In fact, we “bed train” for 8 hours every day while we sleep, but for some reason this does not lead to increased heart muscle strength.
Where is the error?
In fact, the error is on the surface: it is the identification of stroke volume with myocardial contractility. In fact, although these concepts are related, they are not equivalent. This raises a related error of misunderstanding the relationship between stroke volume and exercise. Cardiac output increases in response to an increase in metabolic demand during exercise due to the increase in heart rate and stroke volume, but if the linear pattern of heart rate-exercise dependence is well known, the pattern of the dependence of stroke volume on exercise has not been established. Three main patterns have been described [7, 8]:
- Ascending, when stroke volume increases as the load increases up to V̇O2max.
- Horizontal, when the stroke volume does not change in the recumbent position or reaches a “plateau” at a certain value of V̇O2 (40-50% V̇O2max) in the upright position.
- Descending, when stroke volume decreases in the recumbent position or after recovery in the upright position.
Vieira et al. (2016) in their systematic review [7] failed to draw a conclusion which pattern was true due to conflicting evidence, as were Vella et al. (2005) in a previous review [8], so the problem is still unresolved. To solve it here, we need to dive deeper to the heart of the matter – exercise physiology.
Some physiology
The mechanisms underlying the dependence of stroke volume on exercise have been well known [9]. To begin with, stroke volume is the difference between the end-diastolic volume (EDV) of the left ventricle, i.e. its volume before the ventricle contraction (systole), and the end-systolic volume (ESV), i.e. volume at the end of systole with maximum contraction of the left ventricle. The ratio of stroke volume to EDV is called the ejection fraction and, in fact, it is the ejection fraction, and not the stroke volume, that determines myocardial contractility.
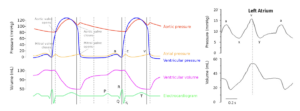
Fig. 2. Lewis-Wiggers cardiac cycle (left) and left atrium cyсle (right) [10].
When load increases above 60% V̇O2max, i.e. after restoration of the postural decrease in stroke volume, cardiac output increases due to a further increase in heart rate and enforced heart contractions, i.e. increase in ejection fraction, and the key issue in the dynamics of stroke volume becomes the dynamics of EDV, determined by the filling of the left ventricle in diastole. This filling occurs in three phases (Fig. 2): (1) the first phase of active-passive filling occurs under the action of elastic traction of the stretched atrium following the Starling law and quickly empties the atrium and reduces its pressure to a minimum (the “y” wave); (2) the blood then flows passively from the pulmonary veins, and the atrium acts simply as a conduit; (3) and finally, during the last 100 ms of ventricular diastole, active atrial systole (wave “a”) occurs as a short booster contraction, which “pumps” the remaining 15% to 20% of EDV into the left ventricle. It is important to understand that this remaining EDV is much more significant in terms of stroke volume, which increases by 20-30%.
As the heart rate increases, the cardiac cycle shortens, and it is important that diastole shortens faster than systole, so that at a heart rate of ~150 bpm their ratio decreases to 1:1 from about 1.6:1 at rest (i.e., when the systole is shortened by half (from 300 ms to 150 ms), the diastole is shortened more than 3 times (from 500 ms to 150 ms)). Moreover, in almost 40% of cases the diastole/systole ratio is reversed at high heart rates, i.e. diastole becomes shorter than systole [11]. The pattern of the ratio change depends on the cardiorespiratory fitness: in healthy men the ratio remains >1 up to the maximum heart rate; in weakened men (patients) it is reversed at about 160 bpm, and in women – already at 120 bpm.
This has important hemodynamic consequences, as shortened diastole reduces filling time and hence EDV. This is actively counteracted by increased left atrial contraction (Fig. 3). EDV, therefore, is determined by the balance of heart rate and the force of atrial contraction and always decreases with increasing heart rate, slightly in athletes and significantly in untrained and especially weakened people. This decrease is compensated by an increase in myocardium contractility, i.e. ejection fraction, so stroke volume is determined by the balance of EDV and ejection fraction, or, ultimately, heart rate and myocardial contractility.
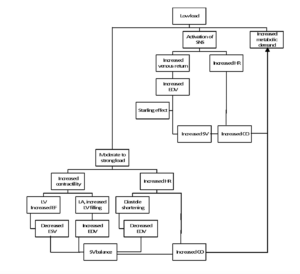
Fig.3. Response of stroke volume and cardiac output to exercise.
Note: SNS, sympathetic nervous system; SV, stroke volume; CO, cardiac output; LV, left ventricle; LA, left atrium; ESV, end-systolic volume; EDV, end-diastolic volume; EF, ejection fraction; HR, heart rate.
Hypothesis: The pattern of stroke volume response to exercise depends on cardiorespiratory fitness
Based on the above, all three patterns of stroke volume versus exercise should occur depending on myocardial contractility or cardiorespiratory fitness.
- With high myocardial contractility (athletes), stroke volume increases, since a progressive increase in myocardial contractility and ejection fraction outpaces the decrease in EDV (which is minimized by the increased filling of the left ventricle due to increased contractions of the left atrium) and compensates for the shortening of diastole.
- In normal myocardium contractility, stroke volume remains constant, as the increase in ejection fraction compensates for the decrease in EDV. It is logical to assume that this pattern would be the most common, which is why stroke volume remains unchanged in most studies.
- With myocardial weakness, a stroke volume decreases, since the decrease in EDV outpaces the increase in the ejection fraction, which, moreover, may not increase at all.
Thus, the error of all studies and reviews is that they try to establish a single correct pattern, when, in fact, all three patterns occur. If so, then the stroke volume pattern should depend on the parameters affecting myocardial contractility – i.e. age, gender, fitness, diseases, etc. – so we can hypothesize that there should be a correlation between the parameters of fitness (primarily V̇O2max) and myocardial contractility (ejection fraction or stroke volume per se) and the pattern of exercise-dependence of stroke volume. It seems that the available data is sufficient to verify this.
Hypothesis testing
An impressive sample of 50 groups and 577 subjects was taken from the Vella et al. review [8], where the data are well prepared, so that almost nothing to add or change (see full table at the end of the blog in the Additional Materials). Minor changes included converting absolute V̇O2max (l/min) to relative (ml/kg/min) using a 70 kg body weight reference (there may be an error here, but within the entire data set it is negligible, as confirmed by sensitivity analysis) and exclusion of groups with uncertain V̇O2max and/or stroke volume (i.e., if presented as a range). Patterns A, B and C were digitized by assigning values of 1, 0 and -1, respectively.
Patterns A, B and C were found in 30%, 48%, and 22% of groups, respectively , consistent with expectations. Correlation analysis showed a moderately strong and statistically significant correlation of the stroke volume pattern with V̇O2max (r=0.42, p=0.013, t=2.6, n=35) and the stroke volume per se (r=0.42, p=0.014, t=2.6, n=33). Sensitivity analysis does not affect the conclusion (r=0.39-0.42, p=0.013-0.021). Considering that the analysis model is extremely unfavorable for detecting correlation because it is based on mean values that smooth out correlation, uses the crudest trinary outcome measure (instead of a more precise continuous measure such as slope, etc.), and includes a number of confounders, the strength of the correlation far exceeds expectations. So much so that this result can be considered sufficient proof of the hypothesis.
Additionally, there was a significant strong correlation between physical fitness (V̇O2max) and stroke volume (r=0.80) with statistical power of 100% (p=1.5×10⁻⁷, t=6.9, n=30), which is not surprising. What is surprising is the strength of the correlation, given that stroke volume is a surrogate measure of myocardial contractility, and taking into account the above limitations of the model. It is likely that the correlation of V̇O2max with ejection fraction, which is a more direct measure of myocardial contractility, would be much stronger, as well as the correlation between ejection fraction and the stroke volume pattern.
What did we find?
So, here we found out two fundamental points:
(1) The effect of slow running is not associated with training myocardial contractility, and;
(2) The pattern of stroke volume versus exercise depends on physical fitness and / or myocardial contractility, so that in trained subjects the pattern is rather ascending (A), in the weakened it is more likely to descend (C), and on average the probability of a horizontal pattern is highest (B). While the first finding is actually an open secret, forgotten or neglected knowledge, the second is new knowledge, albeit derived from existing data.
What does it mean?
This suggests that the force of myocardial contraction in most cases increases with increasing load, manifested by an increase in ejection fraction and not always in an increase in stroke volume, which is an indirect measure of myocardial contractility distorted by the effect of heart rate on EDV. This exposes two major pitfalls of the concept of “maximum stroke volume training” at easy running:
- when a reflex sympathetic increase in stroke volume at light exercise, compensating for the postural decrease in stroke volume, is misjudged as a real increase in myocardial contractility, which has a training effect, and;
- when the lack or modest increase in stroke volume as heart rate increases is misjudged as the lack of increase in myocardial contractility, which is supposedly useless for myocardium training.
Simply put, the concept assumes a training effect where there is none, and misses it where it exists, that is, it is turned upside down.
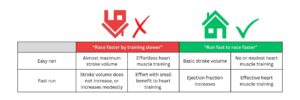
This does not mean that low heart rate running is useless. Its good tolerance allows for higher volumes of running, which results in increased basic endurance, from the muscle recapillarization, strengthening of muscles, bones, joints and ligaments to dilated myocardial hypertrophy and brain and fatigue resistance, but increased myocardial contractility is not in the list. This means that you still have to run fast to race faster, so, in my opinion, the marketing slogan “run slow to race faster” is misleading. Rather, it seems to me that Peter Coe was right when he said: “Long slow distance makes you a long slow runner.”
References
[1] Daniels J. Daniels’ running formula. Human Kinetics; 2013.
[2] Fitzgerald M. 80/20 Running: Run Stronger and Race Faster By Training Slower. Penguin, 2014, 272 p.
[3] Fixx J. The Complete Book of Running. Random House, 1977, 314 p.
[4] Rushmer RF. Constancy of stroke volume in ventricular responses to exertion. Am J Physiol. 1959;196(4):745-50.
[5] Rushmer RF. Postural effects on the baselines of ventricular performance. Circulation. 1959 Nov;20:897-905.
[6] Grimby G, Nilsson NJ, Saltin B. Cardiac output during submaximal and maximal exercise in active middle-aged athletes. J Appl Physiol. 1966;21:1150–6.
[7] Vieira SS, Lemes B, de Carvalho PTC, de Lima RN, Bocalini DS, Junior JAS, Arsa G, Casarin CA, Andrade EL, Serra AJ. Does Stroke Volume Increase During an Incremental Exercise? A Systematic Review. Open Cardiovasc Med J. 2016;10:57-63.
[8] Vella CA, Robergs RA. A review of the stroke volume response to upright exercise in healthy subjects. British J Sports Med. 2005;39:190-195.
[9] Higginbotham MB, Morris KG, Williams RS, McHale PA, Coleman RE, Cobb FR. Regulation of stroke volume during submaximal and maximal upright exercise in normal man. Circ Res. 1986;58(2):281-91.
[10] Walklate J, Ferrantini C, Johnson CA, Tesi C, Poggesi C, Geeves MA. Alpha and beta myosin isoforms and human atrial and ventricular contraction. Cell Mol Life Sci. 2021;78(23):7309-7337.
[11] Bombardini T, Gemignani V, Bianchini E, Venneri L, Petersen C, Pasanisi E, Pratali L, Alonso-Rodriguez D, Pianelli M, Faita F, Giannoni M, Arpesella G, Picano E. Diastolic time – frequency relation in the stress echo lab: filling timing and flow at different heart rates. Cardiovasc Ultrasound. 2008;6:15.
Author information
Sergey Roussakow, MD, PhD (0000-0002-2548-895X)
85 Great Portland Street
London, W1W 7LT, United Kingdome
roussakow@gmail.com
+44 20 3885 0302
Affiliation: Galenic Researches International LLP
85 Great Portland Street
London, W1W 7LT, United Kingdom
Additional Materials
Tab. 1. Stroke volume response to exercise (Vella et al., 2005 [8]).
| Reference* | N | Sex | Age | Type | V̇O₂max | SV | Pattern | ||
|---|---|---|---|---|---|---|---|---|---|
| Chapman et al (5) | 26 | M | 19–63 | 52.9 | 136 | 1 | |||
| Bevegard et al (2) | 8 | M | 17–28 | Endurance trained | 48.6 | 155 | 0 | ||
| Astrand et al (1) | 11 | F | 20–31 | 37.1 | 100 | 0 | |||
| Astrand et al (1) | 12 | M | 20–31 | 57.1 | 134 | 0 | |||
| Grimby et al (3) | 9 | M | 45–55 | Endurance trained | 54.3 | 163 | 0 | ||
| Ekblom (6) | 9 | 22–34 | Athletes | 73.9 | 189 | 1 | |||
| Ekblom (6) | 4 | 22–34 | Athletes | 73.9 | 189 | 0 | |||
| Vanfraechem (22) | 17 | M | 21 | Endurance trained | 65.0 | 122 | 1 | ||
| Crawford et al (23) | 12 | MF | Competitive runners | – | 1 | ||||
| Crawford et al (23) | 16 | MF | Non-competitive runners | – | 0 | ||||
| Hagberg et al (24) | 8 | M | 56 | Master athletes | 56.6 | 133 | 0 | ||
| Hagberg et al (24) | 8 | M | 25 | Master athletes | 62.2 | 131 | 0 | ||
| Hagberg et al (24) | 8 | M | 26 | Master athletes | 70.3 | 133 | 0 | ||
| Hagberg et al (24) | 15 | M | 58 | Passive lifestyle | 29.7 | 109 | 0 | ||
| Higginbotham (4) | 12 | M | 20-50 | Untrained | – | 0 | |||
| Higginbotham (4) | 12 | M | 20-50 | Endurance trained | – | 0 | |||
| Rivera et al (10) | 11 | M | 27-39 | Endurance trained | 70.4 | 137 | 0 | ||
| Rivera et al (10) | 5 | M | 59-81 | Master athletes | 117 | 0 | |||
| Rivera et al (10) | 6 | M | 59-81 | Master athletes | 117 | 1 | |||
| Sullivan et al (16) | 34 | M | 20-70 | 31.5 | – | 0 | |||
| Sullivan et al (16) | 27 | F | 20-63 | 28.4 | – | 0 | |||
| Ogawa et al (17) | 14 | M | 27 | Passive lifestyle | 45.9 | 115 | -1 | ||
| Ogawa et al (17) | 13 | M | 63 | Passive lifestyle | 27.2 | 101 | -1 | ||
| Ogawa et al (17) | 14 | F | 23 | Passive lifestyle | 80 | -1 | |||
| Ogawa et al (17) | 14 | F | 64 | Passive lifestyle | 22.2 | 74 | -1 | ||
| Ogawa et al (17) | 15 | M | 28 | Endurance trained | 63.3 | 154 | -1 | ||
| Ogawa et al (17) | 14 | M | 63 | Endurance trained | 47.6 | 124 | -1 | ||
| Ogawa et al (17) | 13 | F | 26 | Endurance trained | 52.1 | 102 | -1 | ||
| Ogawa et al (17) | 13 | F | 57 | Endurance trained | 35.3 | 85 | -1 | ||
| Leyk et al (25) | 7 | M | 26 | Endurance trained | 57.1 | – | 0 | ||
| Leyk et al (25) | 2 | F | 26 | Endurance trained | 57.1 | – | 0 | ||
| Gledhill et al (7) | 7 | M | 22.5 | Endurance trained | 68.6 | 183 | 0 | ||
| Gledhill et al (7) | 7 | M | 22 | Untrained | 44.1 | 129 | 1 | ||
| McLaren et al (13) | 10 | M | 65 | Non-competitive cyclists | – | 0 | |||
| McLaren et al (13) | 11 | M | 65 | Non-competitive runners | – | 0 | |||
| McLaren et al (13) | 10 | M | 66 | Untrained | – | 0 | |||
| Krip et al (8) | 6 | M | 22 | Untrained | 41.5 | 130 | 1 | ||
| Krip et al (8) | 6 | M | 24.8 | Endurance trained | 64.0 | 171 | 1 | ||
| McCole et al (18) | 11 | F | 63 | Passive lifestyle | – | -1 | |||
| McCole et al (18) | 19 | F | 63 | Physically active | – | -1 | |||
| McCole et al (18) | 14 | F | 65 | Master athletes | – | -1 | |||
| Wiebe et al (11) | 23 | F | 20-63 | Endurance trained | 104-125 | 1 | |||
| Warburton et al (21) | 9 | M | 22 | Endurance trained | 68.9 | 160 | 1 | ||
| Ferguson et al (20) | 7 | F | 18-30 | Moderately trained | 64.3 | 121 | 1 | ||
| Ferguson et al (20) | 7 | F | 18-30 | Endurance trained | 42.1 | 90 | 1 | ||
| Zhou et al (12) | 10 | M | 28 | Untrained | 48.9 | 128 | 0 | ||
| Zhou et al (12) | 10 | M | 26 | Distance runnners | 72.1 | 145 | 0 | ||
| Zhou et al (12) | 5 | M | 30 | Elite runners | 84.1 | 187 | 1 | ||
| Martino et al (9) | 6 | M | 19-22 | Untrained | 89-159 | 1 | |||
| Warburton et al (26) | 10 | M | 18-30 | Endurance trained | 67.8 | – | 1 | ||
| N | 577 | 35 | 30 | 33 | 50 | ||||
| r | 0.42 | 0.80 | 0.42 | ||||||
| t | 2.6 | 6.9 | 2.6 | ||||||
| p | 0.013 | 1.5∙10-7 | 0.014 | ||||||
Note: N, sample size; SV, Stroke volume; * reference numbers are according to Vella et al. [8]; r – Pearson correlation coefficient; t, t-statistic; p, p-value.