Graphic Poem by Luca M. Damiani
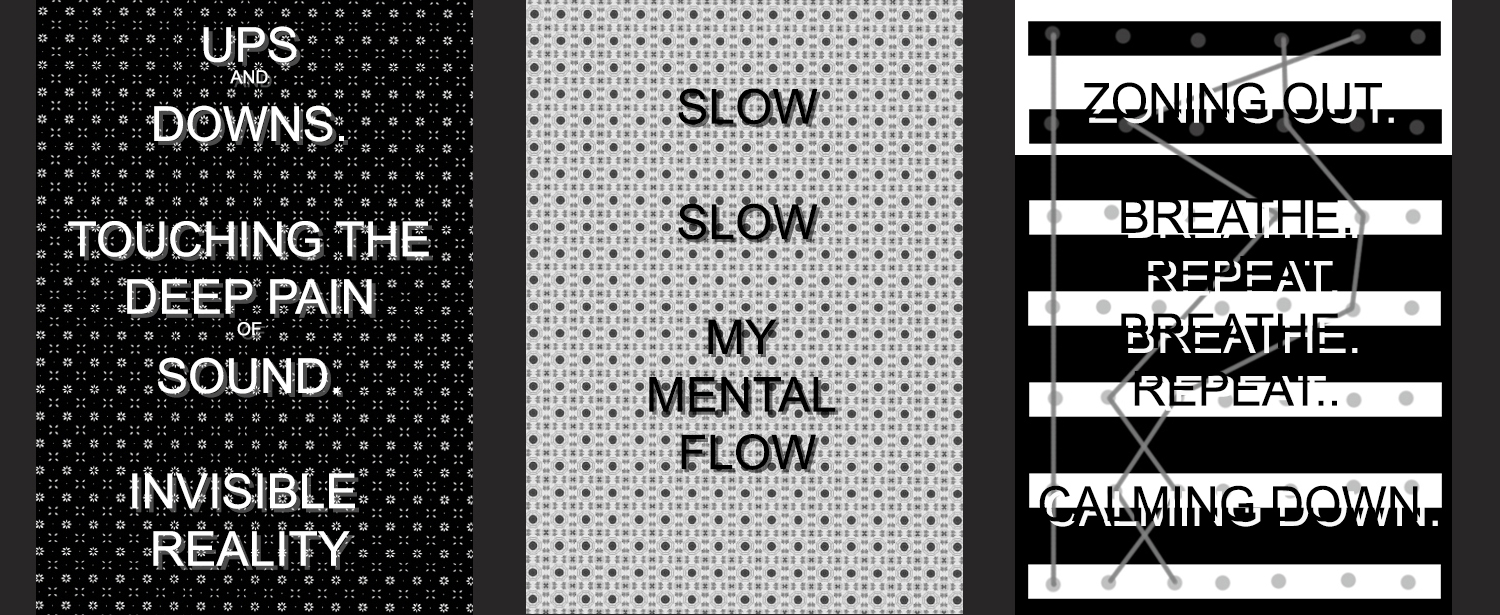
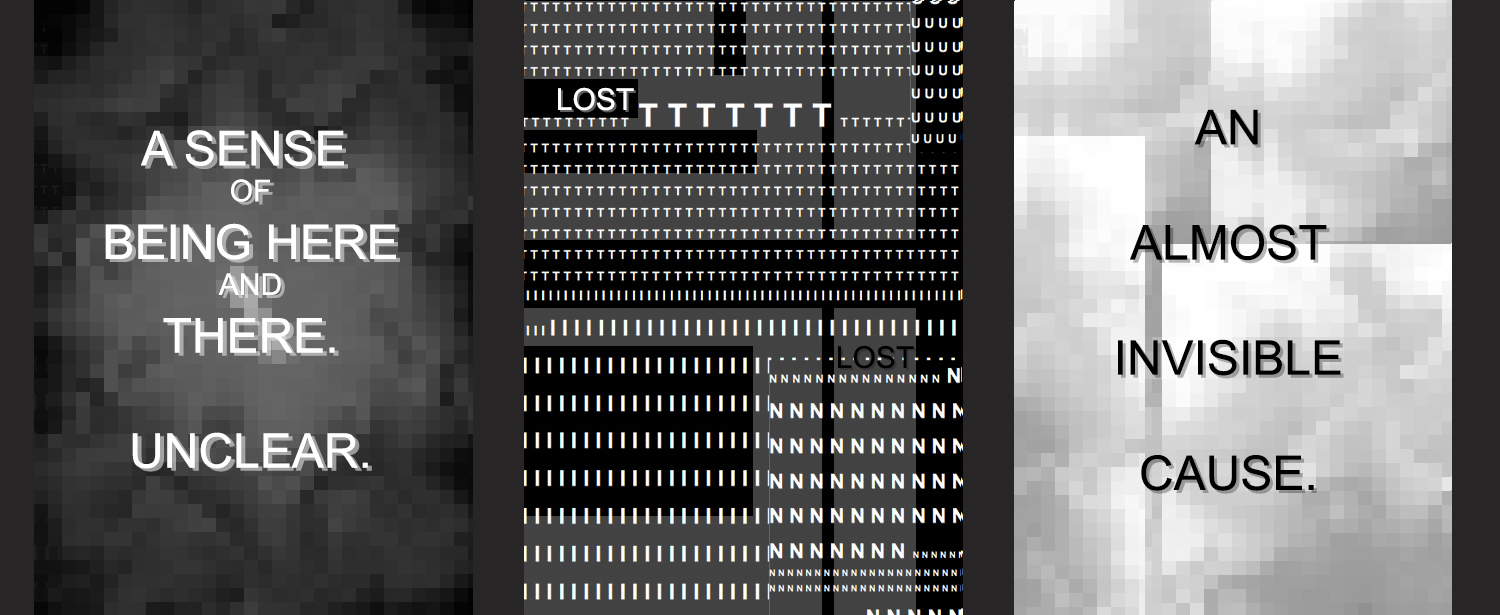
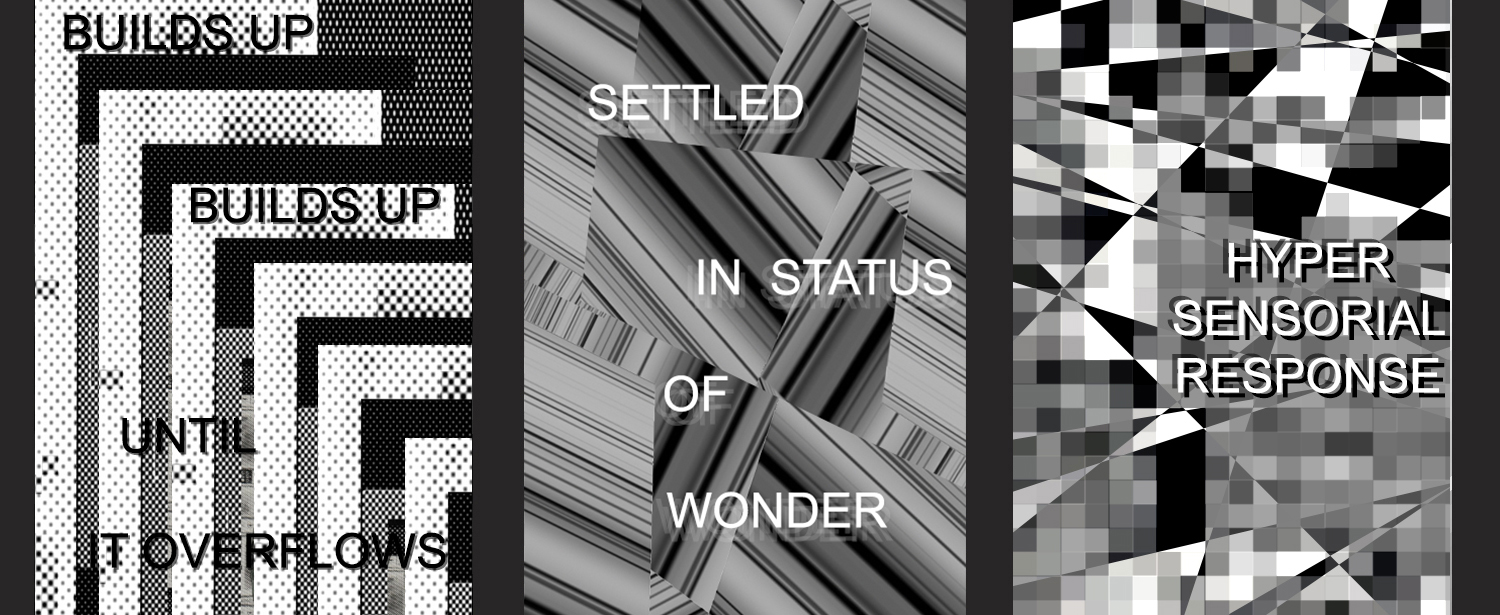
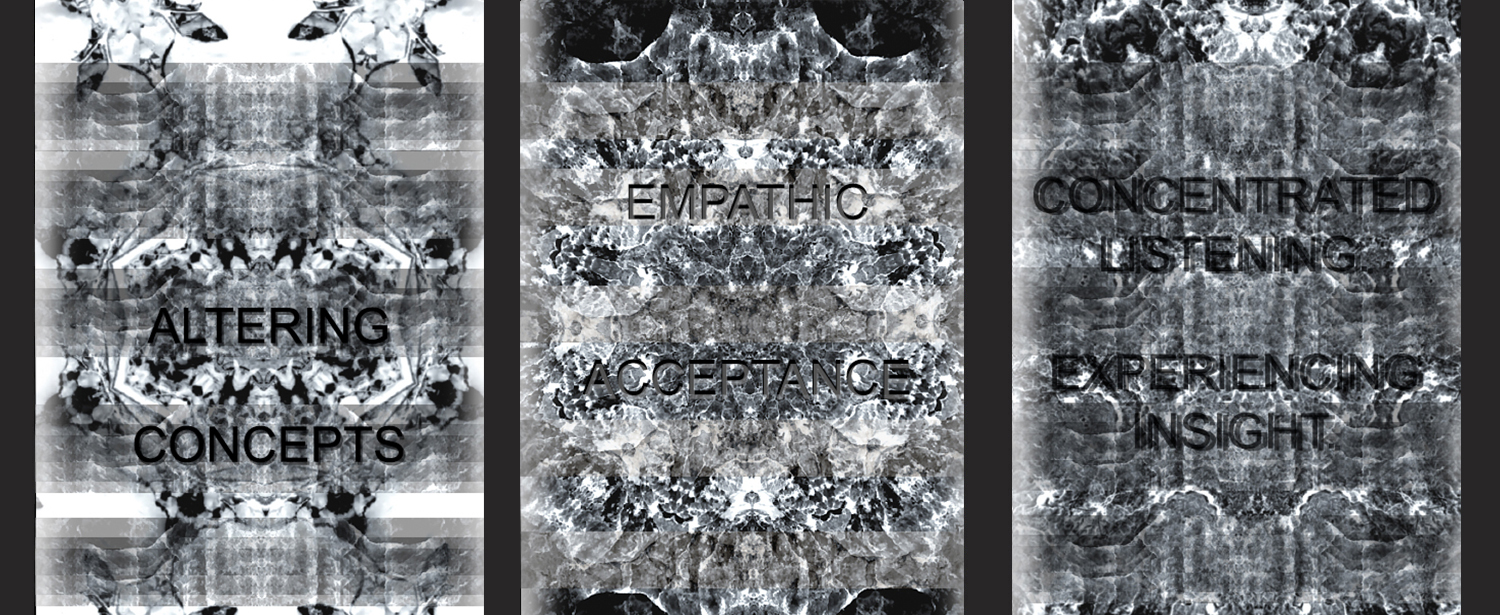
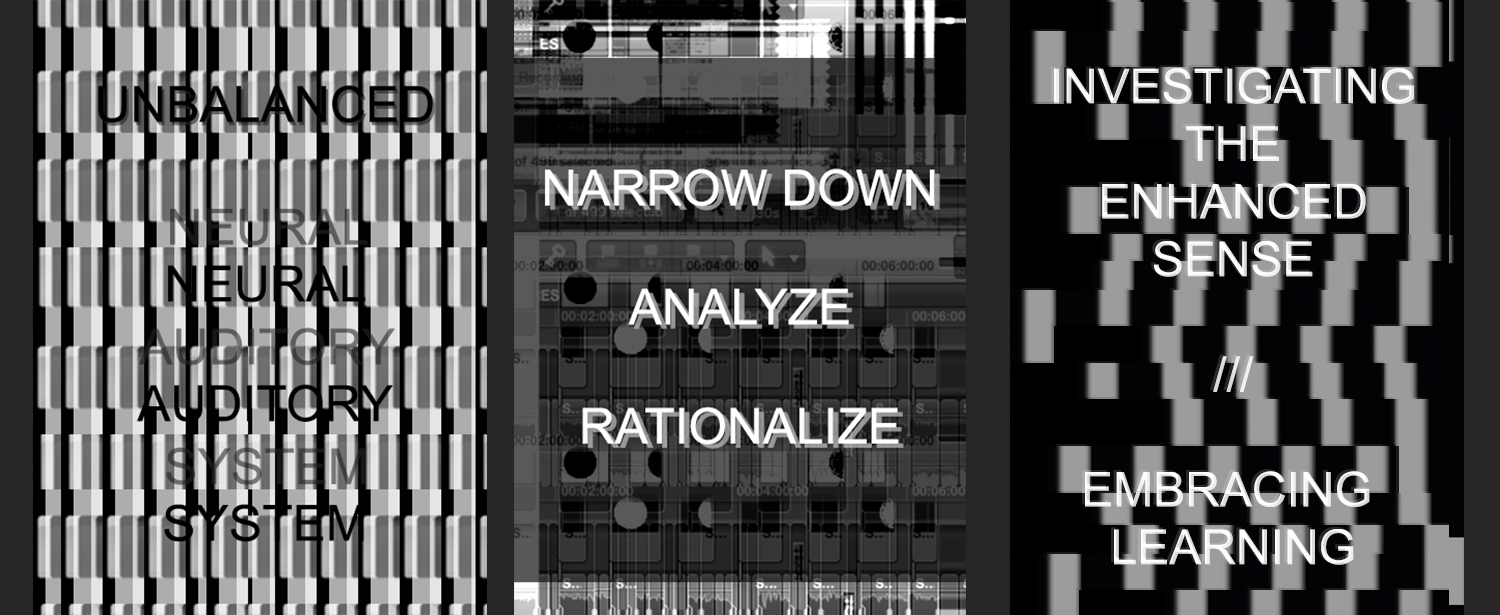
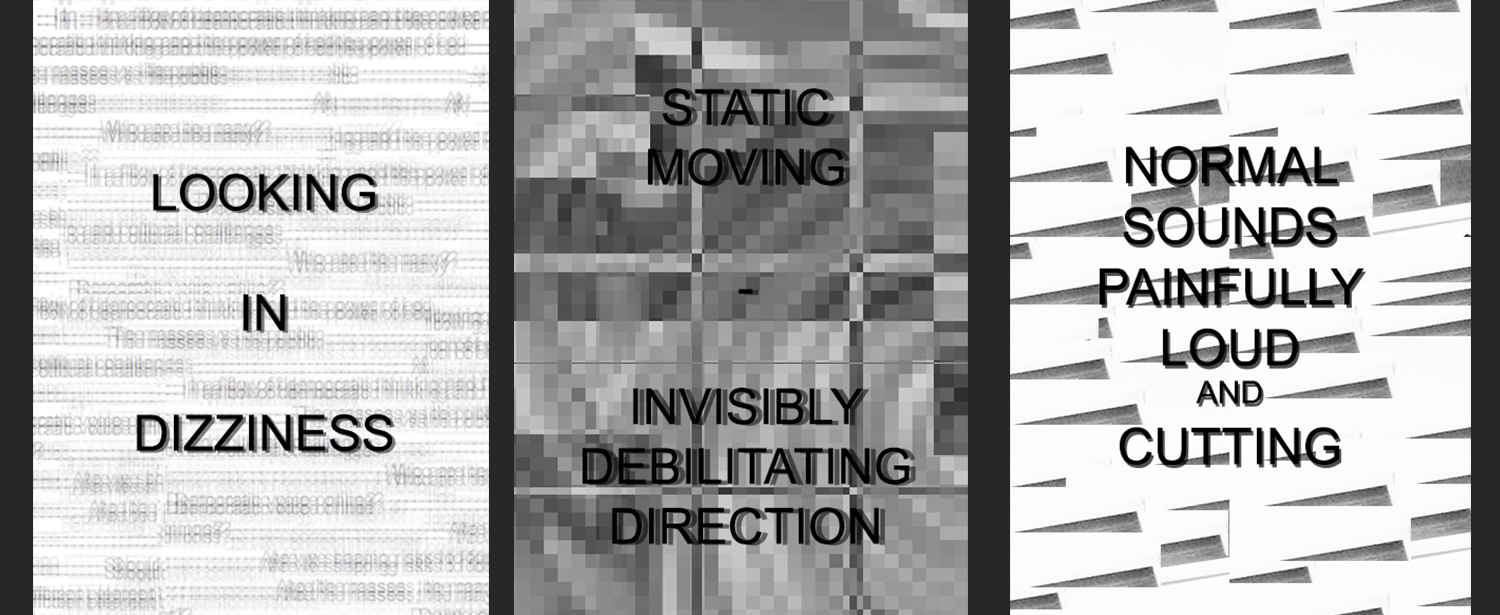
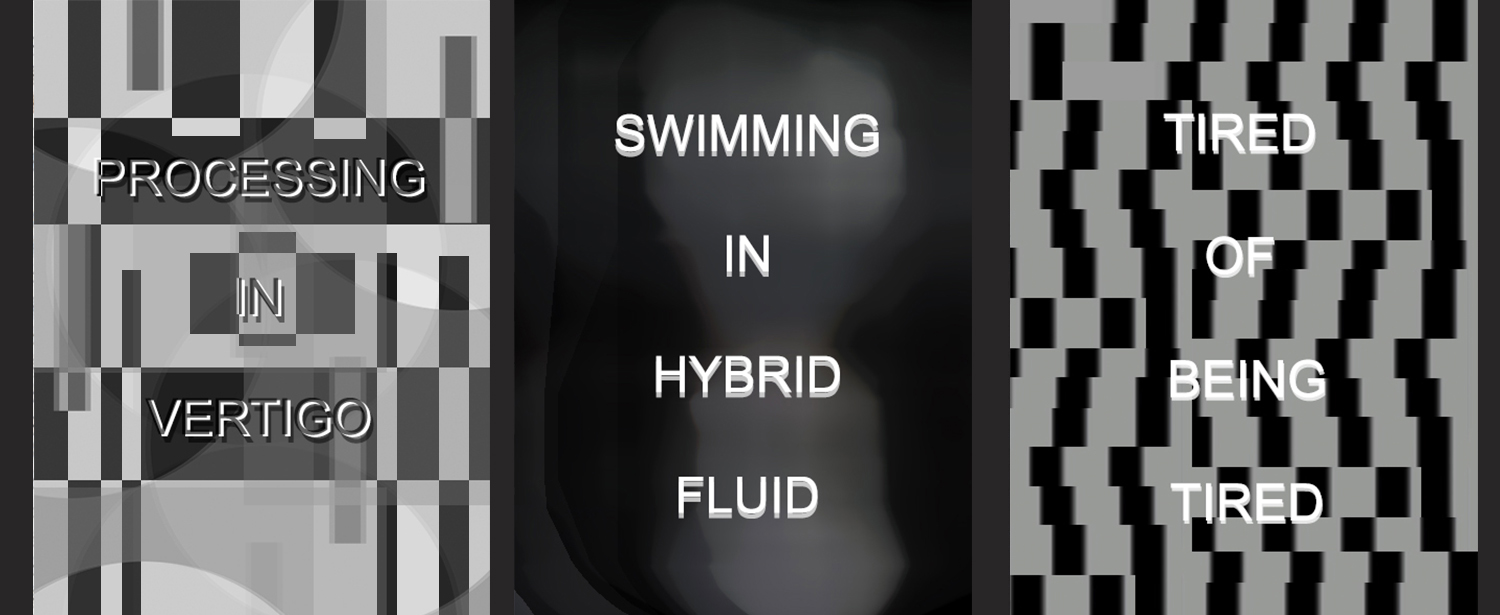
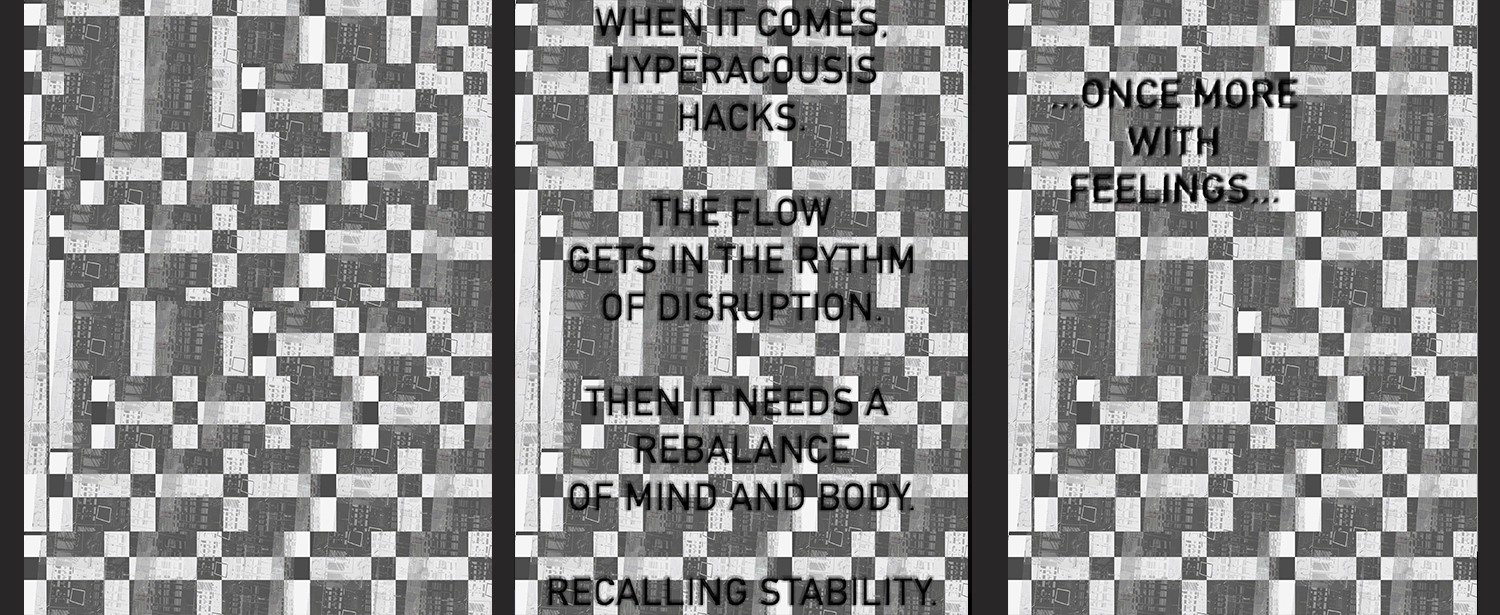
Following from the poem, I then wanted to bridge the emotional response to a more visual one, more coded, using data from the scientific and technical audiological tests, diagrams, tools. This process helped me to analyze and rationalize further observations, allowing a more distant perspective of the data and emotional (including anxiety) response to the condition.
Below is a composition of graphics that shows an interaction between my rational mind and my emotional reflections and feelings, engaging with software technology processing for visualization of those same feelings and connected outer words from the poem. As part of a therapeutic process I am currently following for the hyperacusis condition, and as part of the parallel auto-ethnographic observation, I collect info and notes on my different levels of mood each day. This creates patterns and data that myself and the medical team can use to observe changes that the sensorial disorder brings up. Taking different weekly numerical statistics and data overview from different tracking tools, I then started to abstract the information and create new graphic visualizations of the patterns and mood path, creating a variety of background images. In this work, the connection between collected data and its visualization, follows the idea of abstraction and reductionism in art and brain science.1
Read the other posts in this creative sequence by following the links below:
- Visualizing My Acoustic Condition: Poem, Graphics and Visual Podcast
- Visualizing my Acoustic Condition: Hyper Sensorial Neuro Response (Poem)
- Visualizing my Acoustic Condition: Hyper Sensorial, Visual Graphic Poem
- Exploring Hyperacusis: Ethno-Graphic Podcast
References
[1] Kandel E. (2016) Reductionism in Art and Brain Science. Columbia University Press.