
Having started with Paracelsus’s observation that “only the dose determines that a thing is not a poison”, followed by discussions of chemical affinity and the Law of Mass Action, I now come to dose-response curves.
The term “dose-response curve” is often used interchangeably with the related term “concentration-effect curve”. The former should properly be reserved for a representation of the relation between the administered dose of a drug and its observed effect in a whole animal or human. Since the steady-state dose of a drug is expected to bear a constant relation to the steady-state concentration at the site of action where the measured effect occurs, the in vivo relation between dose and effect (the dose-response curve) is generally taken to be a surrogate for the relationship between the concentration of drug at its site of action and its effect (the concentration-effect curve). Concentration-effect curves can be generated by in vitro or ex vivo measurements but cannot usually be measured in the intact animal, since the concentration at the site of action, with rare exceptions, is not usually known. However, a concentration-effect curve can be generated when the plasma drug concentration is used as a surrogate for the concentration at the site of action. Conventionally the curves are plotted using a logarithmic scale for the concentration or dose—so-called log dose-response curves.
Dose-related and concentration-related response data started to appear in the late 18th century, although they were often published in tables, without any accompanying diagrams, and generally without mathematical analysis. Moreover, when they were plotted, a linear dose scale was generally used. The earliest example of which I am aware in which the response was plotted against the logarithm of the concentration was published in 1926, when Alfred Joseph Clark (1885–1941), then Professor of Pharmacology at University College, London and about to become Professor of Materia Medica at Edinburgh University, demonstrated the action of acetylcholine on frog heart and rectus abdominis muscle (Figure 1). In his 1933 textbook, Mode of Action of Drugs on Cells, and elsewhere, Clark described many such effects, using the term “concentration action curves”, as others had done before.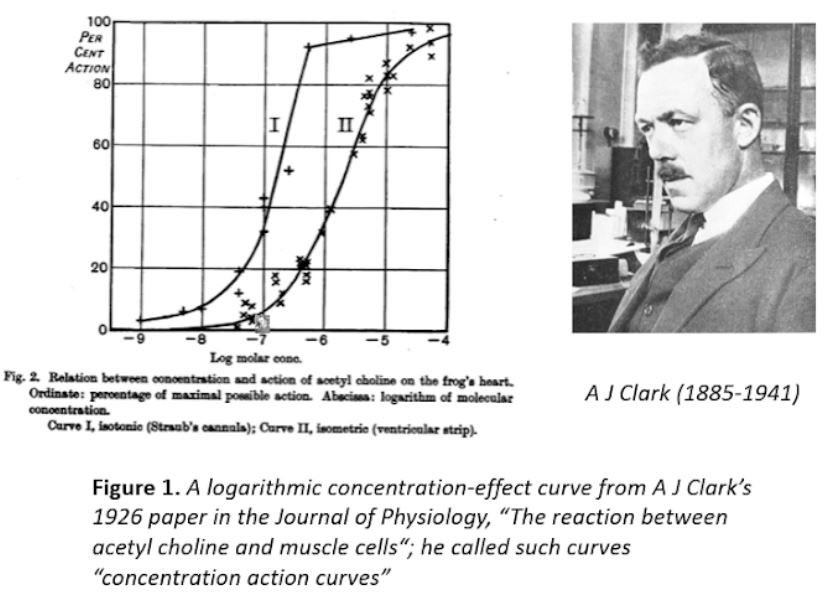
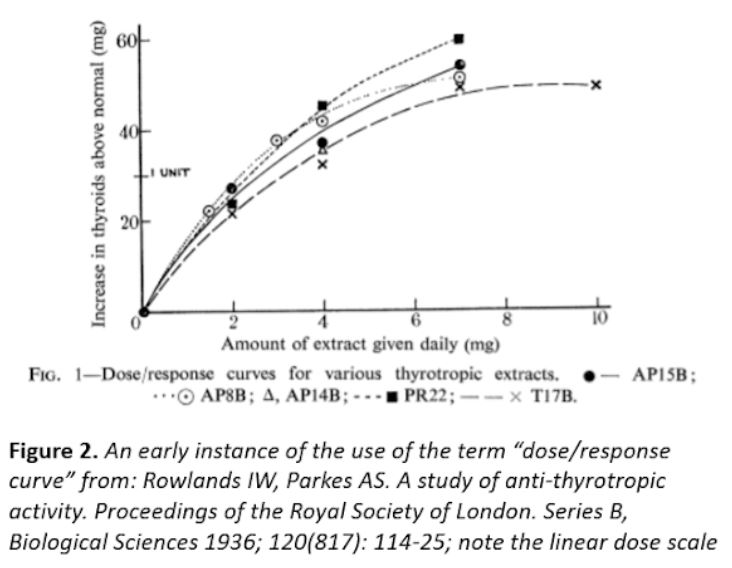
The earliest instance of “dose-response curve” given in the Oxford English Dictionary dates from 1940, although the dictionary also lists a 1932 example of “dosage/response relation” from the Quarterly Journal of Pharmacy and Pharmacology. However, there is an earlier instance of “dose/response curve”, in a paper in the Proceedings of the Royal Society of London. Series B, Biological Science, on the effects of an extract of bovine pituitary on rabbit thyroid glands, dating from 1 May 1936 (Figure 2).
The term “dose-response curve” is much more often used than the term “concentration-effect curve” as can be seen from an analysis of the frequencies with which the terms appear in published papers indexed in PubMed (Figure 3, middle panel). The pattern is unusual. Although concentration-effect and dose-response curves had been recognized for many years, few papers were published (at least in journals indexed in PubMed) until 1975, when there was a sudden increase, with a peak in about 1990, followed by a decline and then a plateau. This is in contrast to the usual type of pattern one expects when searching for specific scientific terms—a monotonic increase. See, for example, my discussion of biomarkers.
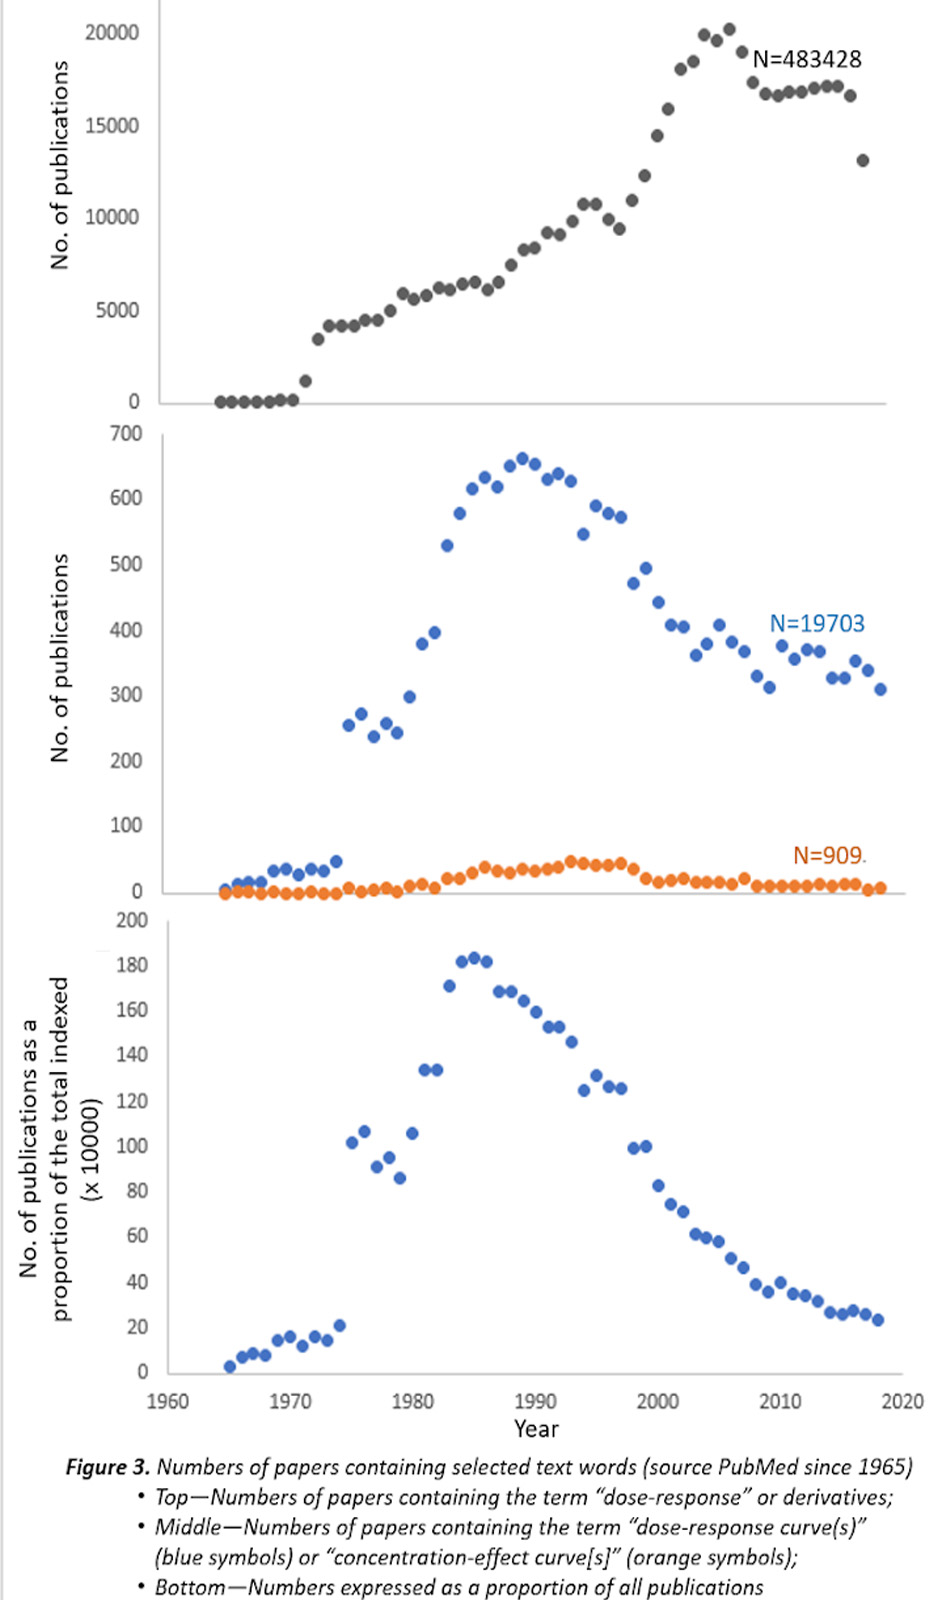
How can we explain the falling numbers after 1990? Publication bias may have played a part, since drug companies will have continued to generate dose-response curves for new medicines without publishing them. However, the top panel in Figure 3 suggests another at least partial explanation. It shows the number of papers indexed in PubMed that have included any term related to dose response, such as “dose-responsiveness”. Since the annual frequency of such terms continues to increase after 1990, and even increases more rapidly after about 2000, this suggests that the idea of dose-responsiveness has continued to receive attention, even though the curves themselves may be being plotted less often. This in turn suggests a kind of Gresham’s Law of scientific terminology—bad terminology driving out good. Perhaps there are other examples.
Jeffrey Aronson is a clinical pharmacologist, working in the Centre for Evidence Based Medicine in Oxford’s Nuffield Department of Primary Care Health Sciences. He is also president emeritus of the British Pharmacological Society.
Competing interests: None declared.