Authors
Tessa Strain, Miriam Alvarado, Flora Jackson, Leandro Garcia, Michael P Kelly, and Paul Kelly
Purpose of this blog
The COVID-19 pandemic saw whole population health protection policies, such as containment strategies or vaccine roll-outs, implemented in many countries at an unprecedented scale. Sometimes these policies were enshrined in law, sometimes they were public health guidance. Whilst ‘universal’ public health policies are thought to reduce population inequalities more than interventions only targeting high-risk groups (1-3), the burden of unintended effects (not always limited to health consequences) may still fall unequally (4). In this blog, we set out a systems-oriented approach for considering how such consequences may differ amongst population subgroups, assisting the development of mitigation strategies. We use the example of changes in adult physical activity levels as a consequence of COVID-19 containment strategies in the UK.
The expected consequences of lockdowns
The first UK containment strategy in response to the COVID-19 pandemic (hereafter referred to as lockdown) was introduced on 23rd March 2020. Individuals were instructed to stay at home unless they needed to shop for essentials, to travel to or from work where absolutely necessary, for one bout of daily exercise, or for medical needs. Restrictions initially eased for most in June 2020 but began to differ between (and sometimes within) the UK home-nations. Over the following 18 months, the UK experienced at least two further periods of comparable restrictions to the initial lockdown.
Swift action on containment when faced with a highly contagious disease was seen as a necessity by many within the public health community. Alongside the potential for widespread severe illness and death, there was a real risk that vital services would be interrupted due to staff shortages. There were numerous immediately obvious unpalatable health consequences to a nationwide lockdown such as the cancellation of non-urgent medical care, suspension of cancer screening, and the mental health effects of isolation. A reduction in overall population physical activity levels was expected given the freedom of movement restrictions, and this has been borne out in subsequent research (5, 6). However, there are also numerous examples of certain groups or individuals increasing or maintaining previous activity levels during lockdown (7,8).
Mapping the potential impacts of lockdowns on physical activity
To help understand this, we present a stock-and-flow diagram (9) to describe the interaction of potential pathways that led to changes in physical activity levels during lockdown, and ultimately on population health (Figure 1). Stock-and-flow diagrams describe how levels of a stock (e.g. people with poor health) change based on the inflow into and outflow from that stock over time. These diagrams help us understand how the system’s structure, formed by interconnected elements, produces the system’s behaviours over time. By differentiating between what prevents people from getting ill (inflow) and what helps people recover (outflow), we can achieve a more comprehensive understanding of the dynamics that set the behaviours of the system as a whole, and of the potential consequences of interventions and policies that take place in this complex and dynamic system.
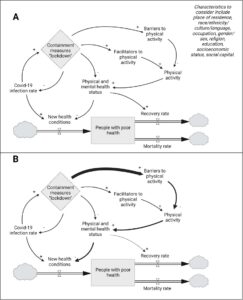
Figure 1. A stock-and-flow diagram showing the hypothesised interactions between the lockdown, physical activity, and population health
Created with biorender.com. As per common notation, clouds reflect the ‘source’ and the ‘sink’ of the stock (people with poor health). The stronger arrow in B from ‘lockdown’ to ‘barriers to physical activity’ reflects the dominant pathway for the majority of the population, although the relative strengths of the arrows to the ‘barriers’ and ‘facilitators’ ultimately determine the change in physical activity levels due to lockdown. The different width arrows downstream indicate the unintended consequences from increased barriers to physical activity. Characteristics listed according to Cochrane’s PROGRESS-Plus list (26).
In our diagram, the universal health intervention of lockdown is shown in the diamond box. The likelihood of a lockdown increases as the COVID-19 infection rate increases, while a lockdown reduces the infection rate. Both the COVID-19 infection rate and other negative health impacts of lockdown on physical and mental health status increase the stock of people with poor health by increasing new health conditions. The two pathways connecting lockdown with physical activity levels represent the positive and negative consequences respectively. It is the relative strength of these two pathways that determine individual as well as population level change in activity levels. Finally, the roles physical activity plays in primary and secondary prevention are illustrated by the arrows connecting to physical and mental health status to the development of new conditions and the recovery rate.
Figure 1B shows how for the majority of adults in the UK, the pathway through the negative consequences was likely stronger. The prohibition of non-essential movement, the closure of sport and exercise facilities, and cancellation of team sports reduced the opportunities to be active and potentially affected motivation. Disruption to routines and additional caring responsibilities have also been identified as barriers to activity during lockdown (10). However, factors strengthening the positive consequences pathway include the increased prominence of activity in Government communications (11) and increased spending on active travel infrastructure, e.g. pop-up walking and cycling lanes and Low Traffic Neighbourhoods (12). There is also tentative evidence that some furloughed workers were able to utilise their increased free time to be active (13).
Consideration of inequalities
A key feature of our diagram is that we have not represented any inequality characteristics as ‘nodes’. We conceptualise the impact of these characteristics (e.g. age, sex, ethnicity, socioeconomic status) as determining how the processes described unfold for different population groups i.e. which arrows are strengthened or weakened. This is in line with Singer’s syndemic theory (14, 15). Inequalities in, for example, physical activity levels are then the observable downstream results of these complex processes. This approach is advantageous when considering the impact of a universal health policy on a specific aspect of health. It encourages us to consider how an inequality characteristic has caused individuals to experience a universal policy differently, rather than relying on an at-risk population identifier (15). It allows us to illustrate both the first and second order impacts simultaneously, i.e. we show the factors interacting that lead to changes in physical activity levels, as well as showing why might these be unequal. This might, at first glance, appear similar to the framework proposed by Katikireddi et al. which maps the unequal consequences of lockdown for ethnic minorities in the UK (16). However, their framework centres on the inequality characteristic of ethnicity and then identifies why the magnitude of impact of lockdown measures would be different across a range of consequences. Our approach encourages the reader to consider how characteristics such as ethnicity led to differential changes/outcomes.
The available surveillance data from England suggests the relative strength of these pathways has not been equal across population subgroups (17). Whilst the proportion meeting the physical activity guidelines was lower in 2020-21 than it was in 2018-19 for both the least and most affluent groups, the least affluent group experienced the greatest drop in physical activity guideline compliance (1.7 versus 0.8 percentage points). Pre-existing inequalities have also widened between different ethnicities. Meanwhile, men and younger adults, who were amongst the most active population subgroups pre-pandemic, saw larger drops in the proportions meeting the guidelines in the initial lockdown than females or middle-aged adults, respectively (18).
Our systems-oriented approach is a starting point for helping to identify plausible reasons for these inequalities. For example, the figure prompts one to ask: who may have experienced a greater increase in barriers to physical activity, who may have experienced a greater increase in facilitators, and why (i.e., what are the structural causes)? Those of lower socioeconomic status, younger adults and people of minority ethnicities were more likely to be working in hard-hit sectors of the economy or where working continued like delivery and taxi drivers (19). There is evidence to suggest those with disabilities have experienced even greater barriers to mobility than those without, due to additional social distancing requirements (20). It is plausible that the larger initial drops in activity levels amongst men and younger adults were partly explained by greater participation levels in organised sports (5). Whether this was replaced with alternatives may have depended on other characteristics, e.g. greenspace access, caring responsibilities, or motivation (21).
Application of the systems-oriented approach in policy making
As noted above, we recognise the challenging position decision-makers were in when faced with widespread COVID-19 transmission and little knowledge about the disease. We put forth this retrospective reflection in the hopes that it may contribute to improving future responses and current recovery efforts. Responses to acute health crises would be strengthened by pre-emptive planning to embed preventive health policies in rapid health protection responses, considering pre-existing inequalities.
While our proposed approach is relatively simple, we argue that it could stimulate debate about unintended consequences, providing a basis for such discussion. The importance of maintaining physical activity levels was clearly understood, as evidenced by its inclusion as one of the four permitted reasons for leaving one’s home. However, this was insufficient for the majority of the population. This was predictable given what was previously known about health inequalities and in physical activity in particular.
We advocate the use of such systems thinking, scenario planning and health inequality impact assessment tools to map these pathways at an early stage to guide policy actions. There will always be unintended impacts of large scale universal policies, but identifying them in advance means efforts can be made to amplify the positive ones and dampen the negative ones. Rather than responding to evidence of widening inequalities and subsequently investigating potential mechanisms, this mapping exercise would focus attention on why inequalities are at risk of widening. This would not only help develop interventions that target the reasons for differential impacts, but also identify the need for them at an earlier stage. This encourages us to consider how an inequality characteristic, or the intersection of several characteristics, renders an individual to be at-risk of being more negatively impacted by a universal health policy than the average. In our lockdown physical activity example, being furloughed has been shown to be associated with an increase in activity levels, on average (13). However, this may only be true for those with the agency to determine how they spend their increased free time, as well as an environment and opportunities conducive to physical activity. Whether that is the case likely depends on a series of socio-demographic characteristics that may not normally be considered in combination if one started with surveillance data. Starting with a systems thinking approach to describing the likely impacts may improve our ability to identify pathways on which to intervene to pre-empt growing inequalities.
We believe this approach could have applications for other universal health policies – sugar tax, vaccine roll-outs, and tobacco control for example. Interventions or the introduction of policy, universal or individually focussed, take place in a complex and dynamic system. Although the usual assumption is that the intervention or policy will have an effect in the system, the system also will affect the intervention outcomes (22). Few would deny this obvious point, but mapping the way it might happen and the complexity of the multiple interactive processes, is an altogether more daunting task. It is what makes prevaluation – thinking through the outcomes in advance of the interventions or the introduction of policy – both so important and so difficult. Our simple point is that the approach allows and facilitates the prevaluation (23).
Implications for post-pandemic physical activity policies
In terms of the implications for post-pandemic physical activity policies, we continue to advocate for a whole system approach (24). For instance, physical activity should be embedded across multiple settings (e.g. travel, recreation) to build resilience when one or more settings are impacted. One of the difficulties faced by local commissioners and providers of public health services is fitting universal policies and interventions to the shape of local communities. It is frequently the case that centrally driven, even evidence-based interventions, need to be nuanced to the needs and the shape and granularity of local communities and populations. Failure to do so may mean that potentially beneficial effects are significantly blunted (25). The approach we have described may be applied locally as well as nationally, and can combined with surveillance data to understand which aspects of lockdown may continue to exert an impact on physical activity levels. It can be refined as more qualitative research emerges explaining why individuals may have experienced very different trajectories in their activity levels during the pandemic.
Conclusions
Many now agree that COVID-19 mitigation efforts were required in Spring of 2020. However, a failure to consider the downstream consequences of universal health policies, and how they may fall unequally across the population can lead to at least partially avoidable medium-to-long term health harms. We argue for a more systemic thinking approach and have presented a simple diagram to guide these considerations and discussions in future population health approaches.
Author information
Tessa Strain 1,2 tessa.strain@mrc-epid.cam.ac.uk
Miriam Alvarado 1, miriam.alvarado@mrc-epid.cam.ac.uk
Flora Jackson 3, flora.jackson@phs.scot
Leandro Garcia 4, L.Garcia@qub.ac.uk
Michael P Kelly 5, mk744@medschl.cam.ac.uk
Paul Kelly 2, p.kelly@ed.ac.uk
1 MRC Epidemiology Unit, Institute of Metabolic Science, University of Cambridge
2 Physical Activity for Health Research Centre, Institute for Sport, Physical Education and Health Sciences, University of Edinburgh
3 Public Health Scotland, Edinburgh
4 Centre for Public Health, Queen’s University Belfast
5 Department of Public Health and Primary Care, University of Cambridge
Conflicts of interest:
TS declares expenses paid to speak at an event organised by Biogredia AB in January 2023. FJ is an employee of Public Health Scotland.
MA, LG, MK and PK have no relevant interests to declare.
Funding Source:
TS was supported by MRC grant MC_UU_00006/4. MA is supported by MRC grant MC_UU_00006/7 and Wellcome Trust grant 218629/Z/19/Z.
References
- Marmot M, Allen J, Goldblatt P, Herd E, Morrison J. Build Back Fairer: The COVID-19 Marmot Review. The Pandemic, Socioeconomic and Health Inequalities in England. London: Institute for Health Equity; 2020. https://www.health.org.uk/publications/build-back-fairer-the-covid-19-marmot-review. Accessed March 6, 2023.
- Adams J, Mytton O, White M, Monsivais P. Why Are Some Population Interventions for Diet and Obesity More Equitable and Effective Than Others? The Role of Individual Agency. PLoS Med. 2016;13(4):e1001990. doi:10.1371/journal.pmed.1001990
- Capewell S, Graham H. Will Cardiovascular Disease Prevention Widen Health Inequalities? PLoS Med. 2010;7(8):e1000320. doi:10.1371/journal.pmed.1000320
- Wright L, Steptoe A, Fancourt D. Are we all in this together? Longitudinal assessment of cumulative adversities by socioeconomic position in the first 3 weeks of lockdown in the UK. J Epidemiol Community Health. June 2020:jech-2020-214475. doi:10.1136/jech-2020-214475
- Strain T, Sharp SJ, Spiers A, et al. Population level physical activity before and during the first national COVID-19 lockdown: A nationally representative repeat cross-sectional study of 5 years of Active Lives data in England. The Lancet Regional Health – Europe. 2022;12:100265. doi:10.1016/j.lanepe.2021.100265
- Stockwell S, Trott M, Tully M, et al. Changes in physical activity and sedentary behaviours from before to during the COVID-19 pandemic lockdown: a systematic review. BMJ Open Sport Exerc Med. 2021;7(1):e000960. doi:10.1136/bmjsem-2020-000960
- Bu F, Bone JK, Mitchell JJ, Steptoe A, Fancourt D. Longitudinal changes in physical activity during and after the first national lockdown due to the COVID-19 pandemic in England. Sci Rep. 2021;11(1):17723. doi:10.1038/s41598-021-97065-1
- Janssen X, Fleming L, Kirk A, et al. Changes in Physical Activity, Sitting and Sleep across the COVID-19 National Lockdown Period in Scotland. IJERPH. 2020;17(24):9362. doi:10.3390/ijerph17249362
- Forrester JW. Industrial Dynamics. Cambridge, Massachusetts: Massachusetts Institute of Technology; 1961. http://www.laprospective.fr/dyn/francais/memoire/autres_textes_de_la_prospective/autres_ouvrages_numerises/industrial-dynamics-forrester-1961.pdf. Accessed March 6, 2023.
- Petersen JA, Naish C, Ghoneim D, Cabaj JL, Doyle-Baker PK, McCormack GR. Impact of the COVID-19 Pandemic on Physical Activity and Sedentary Behaviour: A Qualitative Study in a Canadian City. IJERPH. 2021;18(9):4441. doi:10.3390/ijerph18094441
- Branley-Bell D, Talbot CV. Exploring the impact of the COVID-19 pandemic and UK lockdown on individuals with experience of eating disorders. J Eat Disord. 2020;8(1):44. doi:10.1186/s40337-020-00319-y
- Aldred R, Goodman A. The Impact of Low Traffic Neighbourhoods on Active Travel, Car Use, and Perceptions of Local Environment during the COVID-19 Pandemic. Findings. March 2021. doi:10.32866/001c.21390
- Maddock J, Wielgoszewska B, Green M, et al. Diet, physical activity, and sleep in relation to furlough during the COVID-19 pandemic in the UK: evidence from eight longitudinal studies. European Journal of Public Health. 2021;31(Supplement_3):ckab164.120. doi:10.1093/eurpub/ckab164.120
- Singer M. A dose of drugs, a touch of violence, a case of AIDS: Conceptualizing the SAVA Syndemic. Free Inquiry in Creative Sociology. 1996;24(2):99-110.
- Kelly MP. The relation between the social and the biological and COVID-19. Public Health. 2021;196:18-23. doi:10.1016/j.puhe.2021.05.003
- Katikireddi SV, Lal S, Carrol ED, et al. Unequal impact of the COVID-19 crisis on minority ethnic groups: a framework for understanding and addressing inequalities. J Epidemiol Community Health. 2021;75(10):970-974. doi:10.1136/jech-2020-216061
- Sport England. Active Lives Adult Survey November 2020/21 Report. London, UK: : Sport England 2022. https://sportengland-production-files.s3.eu-west-2.amazonaws.com/s3fs-public/2022-04/Active%20Lives%20Adult%20Survey%20November%2020-21%20Report.pdf?VersionId=nPU_v3jFjwG8o_xnv62FcKOdEiVmRWCb. Accessed March 6, 2023.
- Strain T, Kelly P. COVID-19, Physical Activity, Inequalities Evidence Review. Edinburgh, UK: Public Health Scotland; 2023. https://publichealthscotland.scot/media/18058/covid-19-physical-activity-inequalities-evidence-review.pdf.
- Ipsos MORI. Gender Differences in Attitudes towards Coronavirus. https://www.ipsos.com/sites/default/files/ct/news/documents/2020-05/fawcett_society_presentation.pdf. Accessed March 6, 2023.
- Richardson M, Petrini K, Proulx MJ. Access to exercise for people with visual impairments during the Coronavirus-19 pandemic. British Journal of Visual Impairment. January 2022:026461962110673. doi:10.1177/02646196211067356
- Rhodes RE, Liu S, Lithopoulos A, Zhang C, Garcia‐Barrera MA. Correlates of Perceived Physical Activity Transitions during the COVID‐19 Pandemic among Canadian Adults. Applied Psych Health & Well. 2020;12(4):1157-1182. doi:10.1111/aphw.12236
- Blue S, Shove E, Kelly MP. Obese societies: Reconceptualising the challenge for public health. Sociol Health Illn. 2021;43(4):1051-1067. doi:10.1111/1467-9566.13275
- Samset K, Christensen T. Ex Ante Project Evaluation and the Complexity of Early Decision-Making. Public Organiz Rev. 2017;17(1):1-17. doi:10.1007/s11115-015-0326-y
- Milton K, Cavill N, Chalkley A, et al. Eight Investments That Work for Physical Activity. Journal of Physical Activity and Health. 2021;18(6):625-630. doi:10.1123/jpah.2021-0112
- Ford J, Ekeke N, Lahiri A, Kelly MP. Making the Case for Prevention. A Report for the Health Foundation. Cambridge: Cambridge Public Health, University of Cambridge https://www.phpc.cam.ac.uk/pcu/research/research-groups/crmh/research/crmh-health-inequalities/making-the-case-for-prevention/. Accessed March 6, 2023.
- Cochrane Methods Equity. PROGRESS-Plus. https://methods.cochrane.org/equity/projects/evidence-equity/progress-plus. Accessed April 3, 2023.