Contributions of the FitBack project to the fitness field in Europe and globally
Keywords: fitness, monitoring, youth
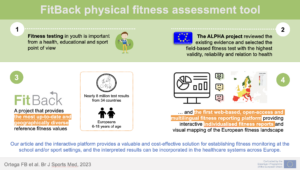
Physical fitness (hereinafter, fitness) testing and monitoring during growth is important from a health, educational and sport point of view. The European Commission funded the FitBack project with the goal of developing a web-based, open-access and multilingual platform that provides individualised reports on fitness levels in children and adolescents according to pan-European reference values and health-related cut-points. In this blog post, we present the implications of fitness assessment in youth and how the FitBack reference values and interactive platform contribute to it, based on our recent study.
Why is this study important?
Fitness is a powerful marker of health in youth and is therefore recommended to be assessed and monitored at individual and population level (1,2). In the past, many individual studies collected fitness data across Europe, however, the availability of different fitness battery/tests hinders the comparability across studies. To standardise fitness testing, the European Union-funded ALPHA project systematically reviewed the existing evidence. An evidence-based selection of the field-based fitness tests have been proposed, with the highest validity, reliability and relation to health, the so-called ALPHA fitness test battery (Figure 1) (3). The ALPHA instructions for testing and videos are available at the FitBack platform: https://www.fitbackeurope.eu/en-us/make-interactive-report/about-testing.
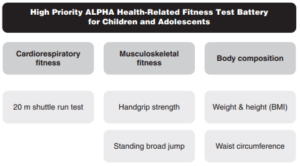
Figure 1. High-priority ALPHA health-related fitness test battery for children and adolescents. BMI indicates body mass index
The FitBack project funded by the European Commission takes a step forward in the implementation of fitness monitoring across Europe as an educational tool for physical literacy. The web-based, open-access and multilingual fitness platform allows the results of fitness testing to be automatically and interactively interpreted based on sex-specific and age-specific reference values and is supported by user-friendly visual feedback and tips for improvement (https://www.fitbackeurope.eu/en-us/make-interactive-report/how-can-i-improve-my-physical-fitness). The reader can test the platform by clicking on ‘Go to individual report’ in Figure 2, or alternatively clicking on ‘Go to group report’, depending on the purpose.

Figure 2. Graphical elements of the FitBack platform for youth fitness assessment and interpretation, available at: www.fitbackeurope.eu
In a recent BJSM issue published in January 2023, we provided fitness reference values (Table 1) based on 8-million test results gathered from 34 European countries, which are the foundation of the FitBack platform, covering all school-ages from 6 to 18 years for the first time.4
Table 1. Example of the reference value tables provided in the article, in this case for cardiorespiratory fitness as assessed by the 20-m shuttle run test (expressed in completed stages as a decimal) in European children and adolescents
| Boys – Age (yr.) | P1 | P5 | P10 | P20 | P30 | P40 | P50 | P60 | P70 | P80 | P90 | P95 | P99 |
| 6.0-6.9 yrs | 0.6 | 0.8 | 0.9 | 1.2 | 1.4 | 1.7 | 2.0 | 2.4 | 2.9 | 3.4 | 4.2 | 5.0 | 6.4 |
| 7.0-7.9 yrs | 0.6 | 0.9 | 1.1 | 1.4 | 1.7 | 2.1 | 2.5 | 2.9 | 3.4 | 4.0 | 4.9 | 5.7 | 7.2 |
| 8.0-8.9 yrs | 0.6 | 1.0 | 1.2 | 1.7 | 2.1 | 2.5 | 3.0 | 3.5 | 4.1 | 4.8 | 5.8 | 6.7 | 8.2 |
| 9.0-9.9 yrs | 0.6 | 1.1 | 1.5 | 2.0 | 2.6 | 3.1 | 3.6 | 4.2 | 4.9 | 5.7 | 6.8 | 7.7 | 9.4 |
| 10.0-10.9 yrs | 0.6 | 1.3 | 1.7 | 2.4 | 3.0 | 3.6 | 4.2 | 4.8 | 5.5 | 6.4 | 7.5 | 8.5 | 10.2 |
| 11.0-11.9 yrs | 0.7 | 1.4 | 2.0 | 2.7 | 3.4 | 4.0 | 4.6 | 5.3 | 6.0 | 6.8 | 8.0 | 9.0 | 10.7 |
| 12.0-12.9 yrs | 0.8 | 1.6 | 2.2 | 3.1 | 3.8 | 4.4 | 5.0 | 5.7 | 6.4 | 7.3 | 8.5 | 9.4 | 11.1 |
| 13.0-13.9 yrs | 0.9 | 1.9 | 2.6 | 3.5 | 4.2 | 4.9 | 5.5 | 6.2 | 7.0 | 7.8 | 9.0 | 9.9 | 11.7 |
| 14.0-14.9 yrs | 1.0 | 2.2 | 2.9 | 3.9 | 4.7 | 5.4 | 6.1 | 6.8 | 7.5 | 8.4 | 9.6 | 10.5 | 12.3 |
| 15.0-15.9 yrs | 1.1 | 2.4 | 3.2 | 4.3 | 5.1 | 5.8 | 6.5 | 7.2 | 7.9 | 8.8 | 10.0 | 11.0 | 12.8 |
| 16.0-16.9 yrs | 1.1 | 2.5 | 3.4 | 4.4 | 5.2 | 6.0 | 6.7 | 7.3 | 8.1 | 8.9 | 10.1 | 11.1 | 12.8 |
| 17.0-17.9 yrs | 1.1 | 2.5 | 3.4 | 4.5 | 5.3 | 6.0 | 6.6 | 7.3 | 8.0 | 8.8 | 10.0 | 10.9 | 12.6 |
| 18.0-18.9 yrs | 1.0 | 2.5 | 3.3 | 4.4 | 5.2 | 5.9 | 6.5 | 7.2 | 7.8 | 8.6 | 9.7 | 10.6 | 12.2 |
Smoothed percentiles were calculated using the Generalized Additive Model for Location, Scale and Shape (GAMLSS) method and weights were applied according to country population. P10 indicates 10th percentile; other percentiles are abbreviated accordingly. Data sources are available at: www.fitbackeurope.eu/en-us/fitness-map/sources.
How did the study go about this?
The FitBack consortium gathered the largest and most recent datasets in paediatric fitness across Europe. For inclusion, valid data on sex, age and at least one of the ALPHA fitness tests (high-priority version) was required. All these sources were used for generating the reference values tables and curves, as well as a visual and interactive mapping of the European fitness landscape (Figure 3).
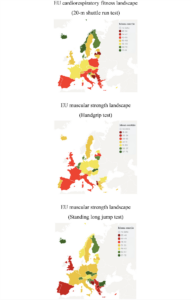
Figure 3. European fitness maps for cardiorespiratory and muscular strength in children and adolescents
What did the study find?
With nearly 8 million test results from 34 European countries, this study provides the most up-to-date and comprehensive reference values and corresponding percentile curves for the health-related fitness of children and adolescents aged 6–18 years (Figure 4).
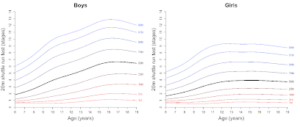
Figure 4. Example of percentile curves provided in the article, in this case for cardiorespiratory fitness as assessed by the 20-m shuttle run test among European children and adolescents.
In addition, country-level rankings are provided for each fitness test, as well as an overall fitness ranking (Figure 5). Interestingly, the Northern (Denmark, Finland, Iceland and Norway) and Central Eastern European countries (Slovenia, Czech Republic and Slovakia) have the fittest children and adolescents, whereas Southern European countries (Spain, Italy and Greece) and the United Kingdom are comparatively less fit. Finally, our study found that, despite cardiorespiratory fitness (CRF) and muscular strength being different fitness components, countries having higher CRF levels generally also had higher muscular strength levels. Since some countries have more representative fitness data than others, all country comparisons should be taken cautiously, and should be revisited when better fitness data are accumulated in certain European countries.
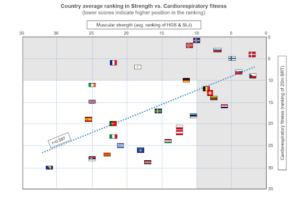
Figure 5. Country average ranking in muscular strength and cardiorespiratory fitness in European children and adolescents. HGS indicates handgrip strength test; SLJ, standing long jump test; 20mSRT, 20-m shuttle run test. Gray shaded areas indicate countries ranked in the top-10 for either muscular strength, cardiorespiratory fitness, or both.
What are the key take-home points?
- Our article and the interactive FitBack platform provide a valuable and cost-effective solution for establishing fitness assessment at the school and/or sport settings.
- Fitness testing is part of the school curriculum in many countries, and the FitBack platform offers physical education teachers across Europe an easy-to-use tool for interpreting fitness test results by sex and age. Countries out of Europe could use this tool as well until they develop their own country or continent specific platforms.
- From a sport perspective, these reference values can help identify young individuals who are talented in specific fitness components.
- From a health perspective, these reference values can help to identify young individuals with a very low fitness levels indicative of poorer health, who should be particularly targeted for physical activity/exercise interventions.
Author and affiliations
José J. Gil-Cosano 1, 2, Francisco B. Ortega, 1, 3, 4 and Gregor Jurak, 5 on behalf of the FitBack consortium and article’s authors.
1 Department of Physical Education and Sports, Faculty of Sport Sciences, Sport and Health University Research Institute (iMUDS), University of Granada; and CIBERobn Physiopathology of Obesity and Nutrition; Granada, Spain.
2 Department of Communication and Education, Universidad Loyola Andalucía, Dos Hermanas, Spain.
3 Faculty of Sport and Health Sciences, University of Jyväskylä, Jyväskylä, Finland.
4 Department of Biosciences and Nutrition, Karolinska Institutet, Huddinge, Sweden.
5 Faculty of Sport, University of Ljubljana, Ljubljana, Slovenia.