Part of the BJSM’s #KnowledgeTranslation blog series
Injury surveillance is an essential step to understanding the risks associated with sports participation and is widely accepted as the first step towards injury prevention [1, 2]. Rugby Union is a field-based collision team sport with a previously reported average rate of 83 injuries per 1000 hours (1000 hours equates to 50 matches: [3]). This study recorded all match injuries that resulted in a player missing a day of training or match play over a 16-season period between 2002/03 and 2018/19 in English Professional Rugby Union.
Figure 1: Study Summary by Adam Virgile
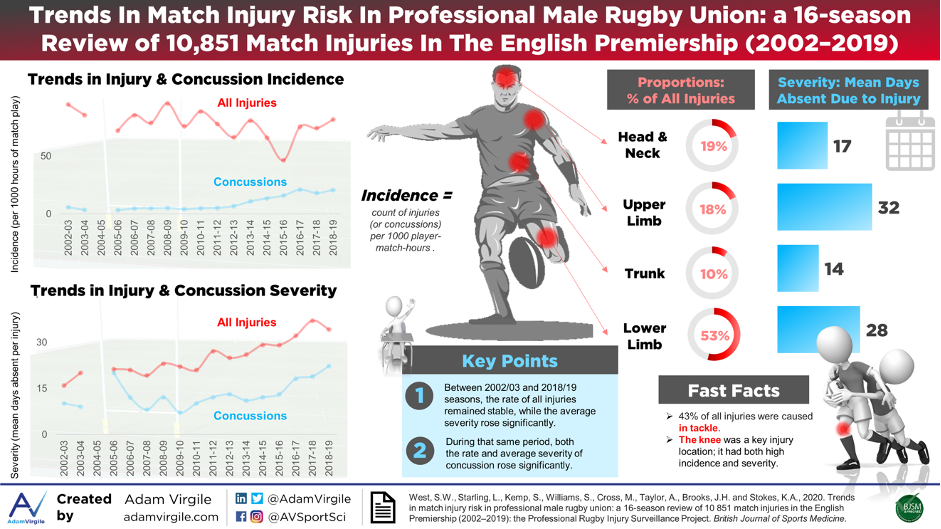
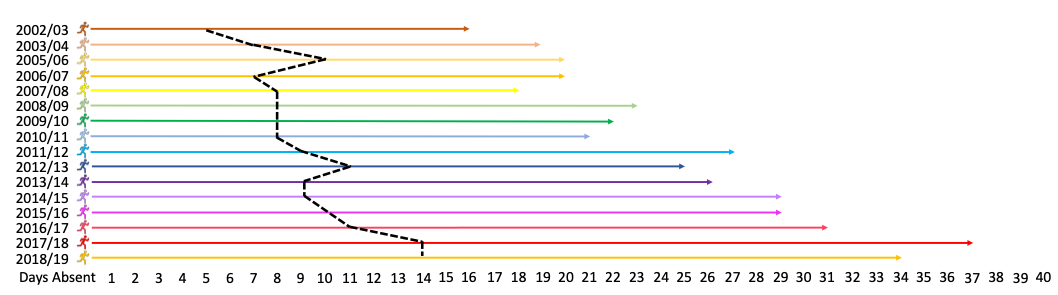
Over the 16 seasons, nearly 11,000 injuries occurred in just under 125,000 hours of player exposure with 54% of players sustaining at least one injury each season. Over this period, the incidence of injury (number of injuries per 1000 hours) remained stable at 87 per 1000 hours, which is comparable to Williams et al (2013). The ~11,000 injuries led to players missing 268,343 days of training and/or matches, with each injury lasting an average of 25 days. The rate of injury remained stable, but the average severity of injuries rose from 16 days in 2002/03 to 37 days in 2017/18 (dropping to 34 in 2018/19). As the mean severity can be skewed by injuries with a high severity, we also investigated the median, which also rose significantly from 5 days to 14 days.
Figure 2: Average (coloured arrows) and median (black dotted line) severity 2002/03 to 2018/19
Where is most commonly injured?
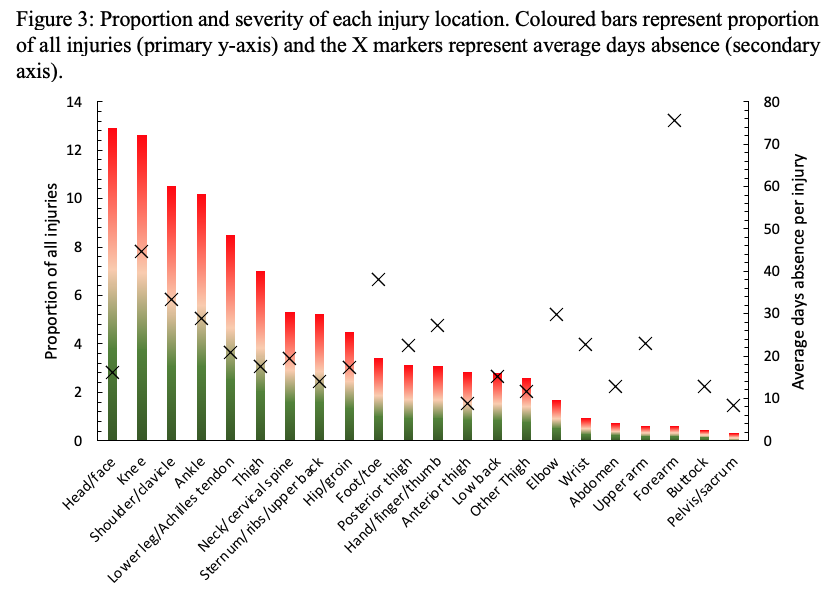
The head/face was the site where the most injuries occurred (12.9% of all injuries) with the knee being the second most common (12.6%). Given that the average severity of knee injuries (45 days) is far higher than that of the head/face (16 days), the overall burden (product of severity and incidence) of these injuries is the greatest. The third and fourth most common injuries were the shoulder (10.5%) and ankle (10.2%), respectively. The injury site with the highest average severity was the forearm, which were associated with an average of 76 days lost. However, forearm injuries accounted for less than 1% (65 in total) of the injuries over the 16 years.
How do these injuries occur?
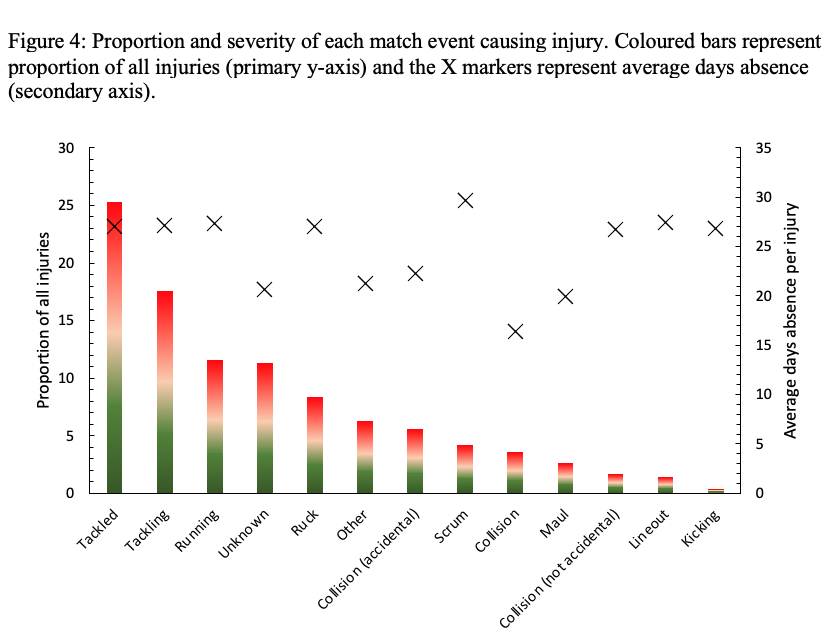
The tackle was responsible for 43% of all injuries that occurred during match play. When sub divided further, we can see that the person carrying the ball (ball carrier) accounts for 25% of all injuries, while the person making the tackle (the tackler) accounted for 18%. Given the high speed and dynamic nature of the tackle, it is unsurprising that this is the most common mechanism of injury. The third most common mechanism of injury was running, which accounted for 12% of injuries.
What about concussion?
Over the period 2002/03 to 2009/10 the rate of concussion remained stable. Since the 2009/10 season, the rate of concussion has risen significantly (3.9 per 1000 hours in 2009/10 to 20.4 in 2018/19). Over the 16-season period, the average severity of concussion was 15 days, however this rose significantly over time (10 days in 2002/03 to 22 days in 2018/19).
Take home points:
- The incidence of injury and the proportion of players injured annually remained stable between 2002/03 and 2018/19
- There was a significant rise in the mean and median severity of injury during this period. This means that when a player received an injury in 2002/ 03, they could have expected to be out for an average of 16 days, while in 2018/19 they can expect to be out for an average of 34 days.
- Over the period 2010/11 and 2016/17, the average incidence, severity and burden of concussion rose significantly.
- Concussion has become the most common match injury since the 2010-11 season.
- The tackle accounted for 43% of all injuries, with 59% of those injuries occurring to the ball carrier, and 41% of the injuries occurring to the tackler.
- The knee, ankle and shoulder were the three highest burden injury sites, however the head/face was the site with the highest proportion of all injuries.
Author and Affiliation:
Stephen West (Department for Health, University of Bath, UK & Sport Injury Prevention Research Centre, Faculty of Kinesiology, University of Calgary, Canada)
Lindsay Starling (Department for Health, University of Bath, UK)
Adam Virgile (College of Nursing and Health Sciences, University of Vermont, VT, USA)
Keith Stokes (Department for Health, University of Bath, UK & Rugby Football Union, Twickenham, UK)
References:
- Van Mechelen W, Hlobil H, Kemper HCG. Incidence, Severity, Etiology and Prevention of Sports Injuries. Sports Medicine. 1992 Aug;14(2):82-99.
- Finch C. A new framework for research leading to sports injury prevention. Journal of Science and Medicine in Sport. 2006 May;9(1-2):3-9.
- Williams S, Trewartha G, Kemp S, Stokes K. A meta-analysis of injuries in senior men’s professional Rugby Union. Sports Medicine. 2013;43(10):1043-55.