By Dr. Christine Voss (@DrChristineVoss)
Originally posted on the Active Streets Active People blog: http://asapactive.wordpress.com/
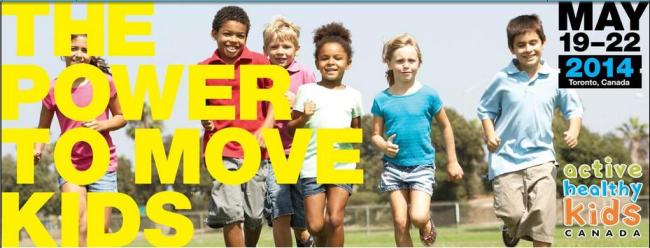
The 2014 Global Summit on the Physical Activity of Children recently brought together researchers, practitioners and policy makers to address the growing childhood physical inactivity crisis. There was an impressive agenda of scientific communications, workshops, debates, networking opportunities, and key note addresses. Notably including health knowledge translation phenomenon Doc Mike Evans (Watch his latest viral video: Let’s Make our Day Harder).
The Physical Activity Report Cards
One of the key highlights of the summit was the release of the 10th Report Card on the Physical Activity of Children and Youth (1), an important knowledge translation tool to inform policy and practice relating to Canadian children’s low physical activity levels. Alongside overall physical activity, supportive indicators that are scored in the report card include: Organized Sport Participation, Active Play, Active Transportation, Sedentary Behavior, Family and Peers, School, Community and Built Environment, and Government Strategies and Investments.
This year for the first time, 14 additional countries, from 5 continents, collaborated to publish their individual, yet similar, physical activity report cards (see Figure 2). Most countries scored relatively poorly for overall physical activity levels; however substantial differences in countries’ individual indicators exist. The international comparison of grades shocked mainstream media and produced headlines such as “Canadian kids near bottom of international physical activity survey” (The Globe and Mail, 20 May 2014; (3)).
Whilst the report fuels further, and necessary, debate over the global physical inactivity crisis, one must still take the findings with a grain of salt. For example, the report compares only 15 countries; 3 out of the 4 participating European countries were from the British Isles. There is disparity between each country’s gathering of information to grade each indicator; this depended on the available type of nationally representative datasets. Full methodologies for each country are available in an open access edition of the Journal of Physical Activity and Health (4).
Is it all about active transportation?
The international comparisons of different countries report cards sparked my curiosity for identifying significant patterns. I wondered whether a good grade in any of the supporting/hindering indicators relates to a good grade for overall physical activity. I assessed these relationships and found that only two of the indicators were meaningfully related to overall physical activity: ‘Active Transportation’ and ‘Community and Built Environment’ (Figure 2).
We already know from a wealth of scientific research that children and youth who walk or cycle to school are more physically active (5), so this finding is not all that surprising. We also know that a supportive neighbourhood environment is related to more physical activity in children and youth (6), so it was unexpected to learn that countries with a better community design score also scored lower for overall physical activity. It is of note that it is predominantly high-income countries that scored well on community design, which highlights that maybe we are comparing apples with oranges in the international report card: what matters a lot in some places, matters little – if at all – in other places. Regardless of methodological shortcomings, international comparisons carry great potential for identifying underlying CULTURAL differences that may be culprit or cure for the global physical inactivity pandemic.
All conference abstracts are accessible in an open access edition of the Journal of Physical Activity and Health (HERE) (7).
*************************
Want more on this topic? Read BJSM’s recently published (open access) article: Is the lack of physical activity strategy for children complicit mass child neglect? By Richard Weiler.
References
- 2014 Report Card on the Physical Activity of Children and Youth: Is Canada in the Running? http://www.activehealthykids.ca/ReportCard/2014ReportCard.aspx
- Tremblay et al. Physical Activity of Children: A Global Matrix of Grades Comparing 15 Countries. 2014, J Phys Act Health, 11(Supp 1), S113 – S125; http://dx.doi.org/10.1123/jpah.2014-0177
- Global Summit on the Physical Activity of Children 2014 Special Issue. 2014, J Phys Act Health. 11(Supp 1), S1-S207. http://journals.humankinetics.com/jpah-supplements-special-issues/jpah-volume-11-2014-global-summit-on-the-physical-activity-of-children
- Larouche et al. Associations between active school transport and physical activity, body composition, and cardiovascular fitness: a systematic review of 68 studies. 2014, J Phys Act Health. 11(1):206-27. doi: 10.1123/jpah.2011-0345
- Ding et al. Neighborhood environment and physical activity among youth a review. 2011. Am J Prev Med. 41(4):442-55. doi: 10.1016/j.amepre.2011.06.036
- 2014 Global Summit on the Physical Activity of Children: Abstracts. 2014, J Phys Act Health, 11(Supp 1), S126 – S198; http://dx.doi.org/10.1123/jpah.2014-0173
**************************************
Dr Christine Voss (@DrChristineVoss) is a post-doctoral research fellow at the Centre for Hip Health and Mobility, University of British Columbia in Vancouver, Canada. Her research interests centre around the interplay between active travel to school, the built environment, and health in children and youth.

