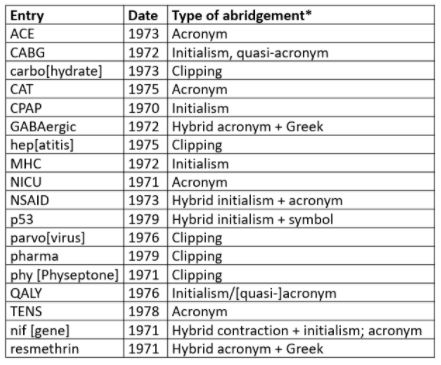
Dictionaries not uncommonly include abridged versions of words and phrases. The abridged biomedical words in the Oxford English Dictionary (OED) listed as being first cited in the 1970s are given in Table 1. The different types of abridgement are often called “acronyms”, but an acronym is only one type of abridgement; for the others see the footnotes to the table.
Table 1. Abridged biomedical entries in the OED 1970–9
*Terminology:
- Initialism—a single letter standing for a whole word, or a string of such letters; B, for instance, stands for bachelor, baron, and boron, among others, b.d. for bis [in] die, and BMJ for the Builders Merchants Journal; in such cases the letters are pronounced separately
- Acronym—a specific type of abbreviation that can be, and is, read as a word; for example, AID, AIDS, and ARC
- Quasi-acronym—an initialism adapted to be an acronym; for example, the initialism CABG is read as if it were the word “cabbage”; QALY could be regarded as such an initialism or as an acronym
- Clipping— a coinage formed by removing the end of the word; for example, “dex” for dexamethasone; pronounced like a real word
- Contraction—a coinage formed by removing a section or sections of a word (for example, Dr, Mr, ECG, trp); pronounced as the original word is, or as an initialism, or as if it were itself a word
- Symbols—signs that stand for words; for example, numbers, @, £
- Hybrid—an abridgement that combines different types, such as part initialism, part symbol
- Portmanteau word—a blend of two words; for example, Botox (no examples in this list)
Most of the years that I have been surveying since 1970 afford at least one example of a biomedical abridgement, and 1982, surveyed this week (Table 2), is no exception, with seven examples: Botox (a blend from botulinum toxin), RU-486 (the manufacturer’s code name for mifepristone, the 38,486th compound synthesized by Roussel–Uclaf), sensi (an abbreviation of sinsemilla), tox (a clipped version of toxicology), COX (an acronym/contraction = cyclo-oxygenase), AIDS (an acronym = acquired immune deficiency syndrome), and R0.
Table 2. Biomedical words (n=31) in the OED for which the earliest citations are from 1982 (out of a total of 229); I have found three antedatings (2–8 years)
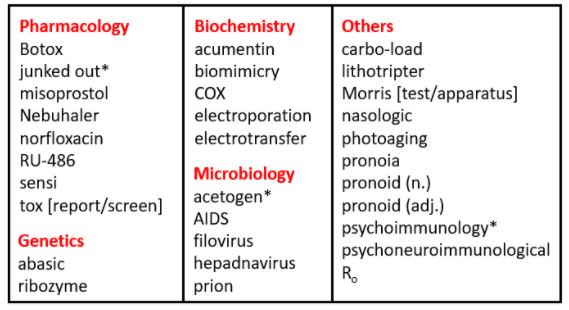
*Antedatings: junked out (1974); acetogen (1980); psychoimmunology (1974)
R0 is a hybrid abridgement, combining the initialism R, for reproduction, and the symbol 0, for zero. It is often pronounced “ar zero” or “ar nought”. It is defined as the number of cases that are expected to occur on average in a homogeneous population as a result of infection by a single individual, when the population is susceptible at the start of an epidemic, before widespread immunity starts to develop and before any attempt has been made at immunization. If one person develops the infection and passes it on to two others, the R0 is 2.
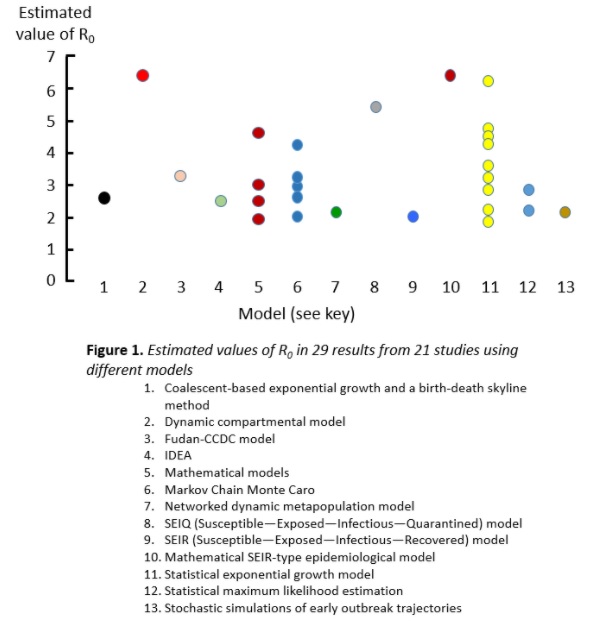
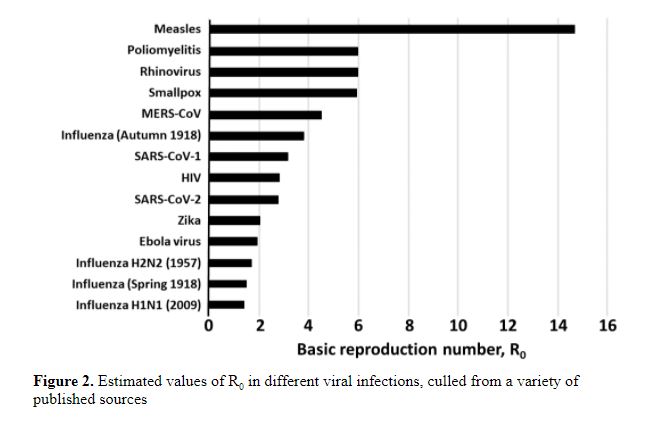
If the average R0 in the population is greater than 1, the infection will spread and increase exponentially. If R0 is less than 1, fewer people will be affected in a given time, and it will eventually die out. I have illustrated this in a previous column. It is not clear what the R0 for SARS-CoV-2 was at the start of the first wave in early 2020; estimates are shown in Figure 1 from a systematic review; the mean estimate was 3.38 and the range 1.9–6.49. The huge variance comes from the different sources of data and the different models used to analyse them. Estimates of the mean values of R0 in other infections are shown in Figure 2.
Although the term “R number”, which was first recorded in 2006, has become common parlance, it is much misunderstood. One difficulty arises from differentiating the numbers of cases prevalent at any time and the total number of cases that have accumulated; as the daily number of cases rises and then falls, the accumulated number of cases rises to a plateau, as I have also previously illustrated. Another problem arises from the fact that the value of R changes throughout an epidemic. R0 is the value at the start, but as the population becomes less susceptible, R changes. It is then called Re, the effective reproduction number, or sometimes Rt, the reproduction number at a given time. For this reason, the actual number of cases that eventually occur does not match the number that would be expected from calculations made based on R0 alone, and initial predictions may not be fulfilled.
The concept of a reproduction number first emerged in 1927, in a paper by WO Kermack and AG McKendrick, “A contribution to the mathematical theory of epidemics”. However, the term R0 was not introduced until 1982, by Roy M Anderson and Robert M May, in a paper titled “Directly transmitted infectious diseases: control by vaccination”. They called it the “intrinsic reproductive rate”, although it is not a rate but a ratio. The abbreviation R for reproduction had already been introduced in 1974 by Dietz.
Using the idea of R0 I have been analysing the numbers of death that have been attributed to covid-19 in the UK since March 2020 (Figure 3). The first wave, from March to July, can be modelled by using a starting value of R (R0) of 5 and allowing Re to fall monotonically, adjusting the rate of fall so as to generate a curve that closely matches the data, assuming a constant mortality rate. However, the deaths in the current wave cannot be modelled in the same way, because of the discontinuity in the numbers. At the start of the wave the numbers of deaths rose, peaked, and then started to fall, as would be expected. However, the numbers then took an unexpected second upturn. Some have attributed this to the Christmas break, during which lockdown restrictions were relaxed. However, there is an alternative explanation, namely that the second upturn in fact signals a completely different wave. Making this assumption, one can deconvolute the current wave into two separate waves, as shown in the figure. Are we in fact currently suffering a third wave, perhaps due to a variant of the virus?
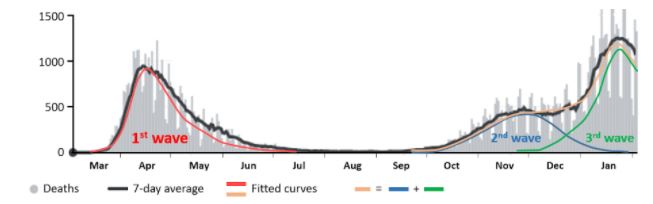
Figure 3. Published numbers of deaths attributed to covid-19 in the UK since March 2020; the daily numbers (from JHU CSSE COVID-19 Data) are in grey, with the7-day averages in black; the coloured lines have been generated by setting values of Re that fall monotonically from R0 over time; the red curve shows the first wave of infection; the blue and green waves show two hypothetical later waves, which together (orange curve) add to give the second black curve, currently being called the second wave
Jeffrey Aronson is a clinical pharmacologist, working in the Centre for Evidence Based Medicine in Oxford’s Nuffield Department of Primary Care Health Sciences. He is also president emeritus of the British Pharmacological Society.
Competing interests: None declared.