The story so far: I have previously described four different pattern of changes with time that exponential functions generate, depending on what is being measured and whether the exponent is positive or negative:
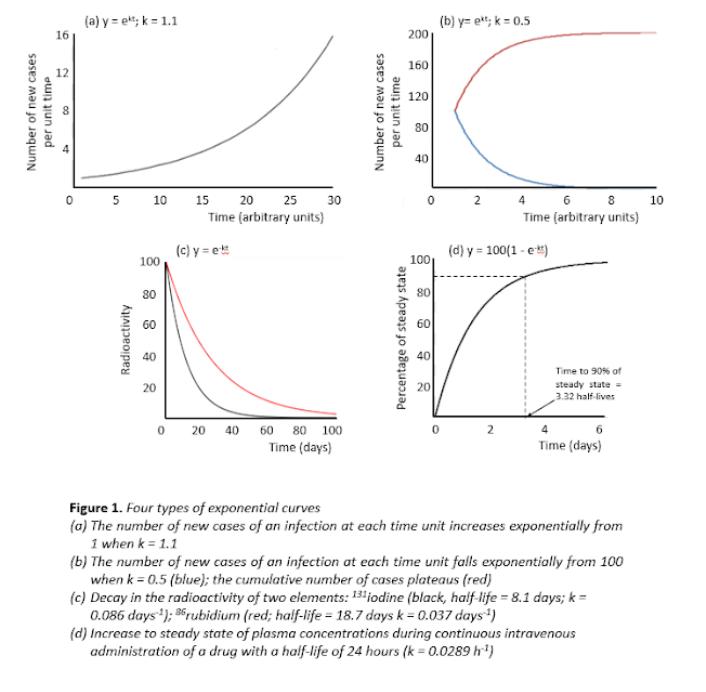
- If what you are measuring is the number of new cases of infection entering a population, the curve showing how the number of new cases appearing with time increases if the exponent is positive and the rate constant, call it k, is greater than 1: the function is ekt where k > 1 (Figure 1a); in this case the total number of cases in the system also increases exponentially.
- If the rate constant, k, in that case is less than 1, the curve decreases; the function is still ekt, but now k < 1 (Figure 1b); fewer new cases arise as time goes by, and although the total number of cases increases, it eventually reaches a maximum as the epidemic ends (Figure 1b).
- If what you are measuring is the rate at which something leaves a system the exponent is negative; this applies to rates of decay of radioactivity of an isotope, current in a circuit, and plasma or tissue concentrations of a drug after administration; the function is e–kt where k can take on any value. Two examples are shown in Figure 1c.
- If what you are measuring is the rate of accumulation of something in a system with continuous input (e.g. a continuous intravenous infusion) and exponential output, the function becomes slightly different: (1 – e–kt) (Figure 1d).
Now, what happens if we combine some of these functions?
Chains: combining two exponentials
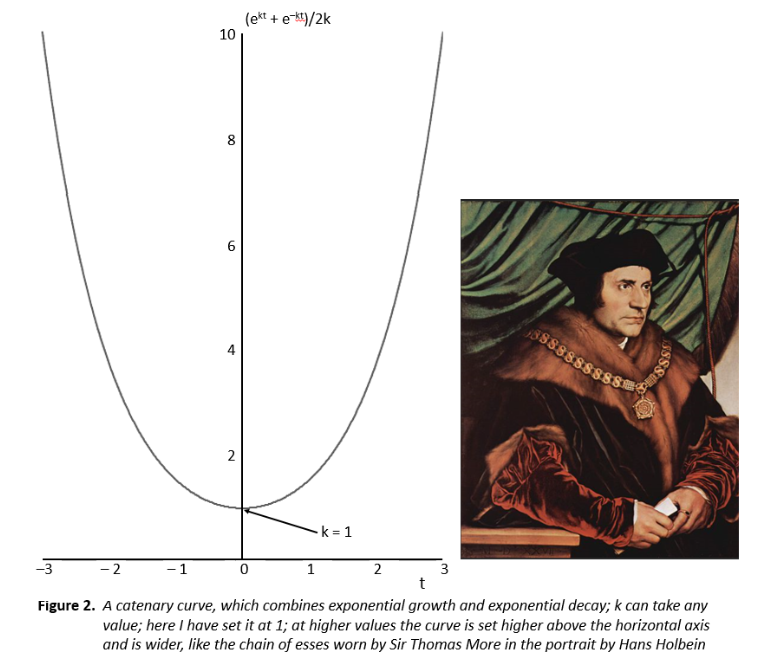
The problem of finding the function that describes the shape that a chain takes when it hangs around your neck or a rope when it is fixed at two points in the same horizontal plane was one that puzzled 17th century mathematicians. This shape is known as a catenary, from the Latin word catena, meaning a chain. [Spoiler non-alert: anyone hoping to learn about Paul Mescal’s chain in Normal People will be disappointed.]
They thought at first that it must be a parabola, which has the function y = ax2, but that didn’t quite fit. The problem was finally solved by three mathematicians separately, Christian Huygens, Gottfried Wilhelm Leibnitz, and one of the Bernoulli brothers, Johann, although it was another brother, Jakob, who had proposed the problem. What they discovered was that the function was the sum of two exponentials (ekt + e–kt)/2k (Figure 2).
A changing viral reproduction number: varying the exponential continuously
What happens to the numbers of new cases arising if R, the reproduction number of the virus changes from day to day? We can get some idea of the answer to that question if we try combining the two exponential in Figures 1a and 1b, letting k vary. I have done that in Figure 3. I began with one individual and assumed that the initial value of R was 2.7 and that it then varied continuously down to 0.1 over 60 days. The result was similar in shape to the inverted catenary, and the cumulative numbers of cases came to just under 250 000. For comparison, the currently reported number of cases of covid-19 in the UK is just over 200 000.
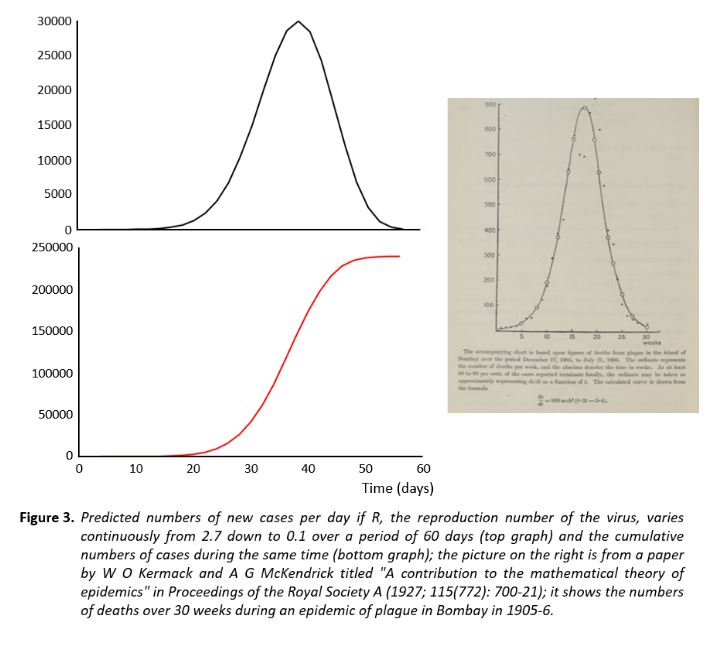
Of course, this is just a model, and it is unlikely that the value of R varies continuously in the way I have modelled it. Furthermore, the numbers that the model generates are very sensitive to the starting value of R. However, the result does show the general shape of the curve that is to be expected during an epidemic. For comparison, I have included in Figure 3 a copy of a figure from a paper by the Scottish biochemist William Ogilvie Kermack and his colleague, the physician and epidemiologist A[nderson] G[ray] McKendrick (whose full given names were not published in the paper).Their analysis became known as the Kermack–McKendrick theory of infectious diseases, from which the concept of the reproduction number was derived.
Our response to the current pandemic is strikingly similar to the response to the 1918–19 influenza pandemic: failure to take it seriously at the start and eventually, with an increasing death toll, isolation and masks. The epidemiology hasn’t changed either.
Jeffrey Aronson is a clinical pharmacologist, working in the Centre for Evidence Based Medicine in Oxford’s Nuffield Department of Primary Care Health Sciences. He is also president emeritus of the British Pharmacological Society.
Competing interests: None declared.