 Last week I discussed the origins of the terms “dose-response curve” and “concentration-effect curve”, which are often used interchangeably.
The pharmacologist Alfred Joseph Clark (1885–1941) was the first to observe that when the concentration scale on a pharmacological concentration-effect curve (which he called a concentration-action curve) was transformed from a linear scale to a logarithmic one, the typical shape, a rectangular hyperbola, was converted to an S-shaped (sigmoid) curve, and that the part of the curve from 20–80% of the maximum effect was approximately linear.
Different types of dose-response curve are well illustrated in data from a single set of experiments by R P (Steve) Stephenson (1925–2004), published in a paper that some have considered the most important pharmacological paper to have been published in the 20th century (Figure 1). Stephenson generated concentration-effect relationships by exposing guinea-pig ileum in vitro to a series of alkylated trimethylammonium salts, which caused the ileum to contract. His data, plotted as log concentration on the horizontal axis versus effect as a percentage of maximum on the vertical, illustrate two major features of concentration-effect curves, which are described by terms that need to be distinguished: potency and efficacy. Potency refers to how much drug is needed to produce an effect and efficacy refers to the extent of the effect that can be achieved when the effect is maximal.
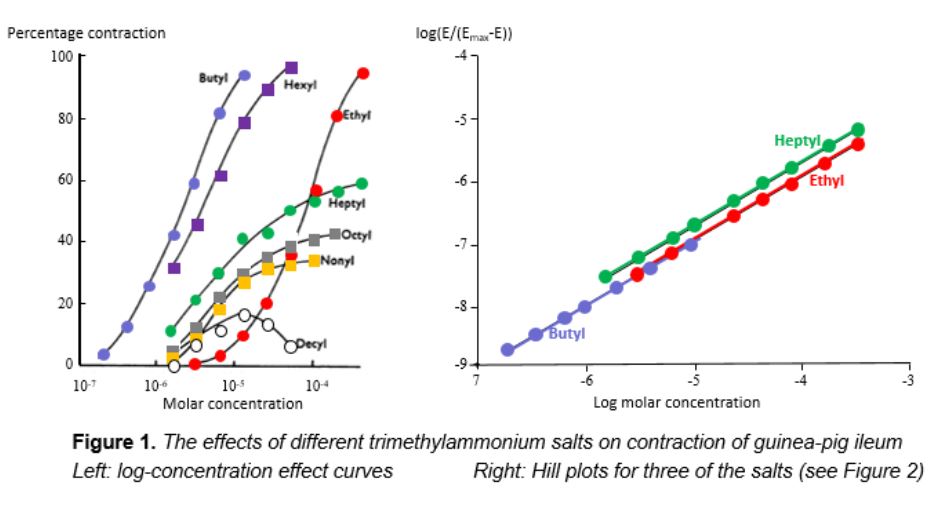
Consider the curve generated by exposure to the ethyl salt. The curve is sigmoid in shape. At a concentration of about 10-6 mol/L there is no contraction; as the concentration rises to just above 10-4 mol/L there is increasing contraction, and at higher concentrations no further contraction is achieved. The curves for the butyl and hexyl salts are similar; they have the same sigmoid shape and plateau at the same maximum contractile effect. However, the three curves are at a distance from each other—the same effects are produced by different concentrations, in other words they have different potencies; the butyl salt is more potent than the hexyl, producing the same effects at lower concentrations, and the hexyl salt is more potent than the ethyl.
The curves for the heptyl, octyl, and nonyl salts are different. They too have different potencies, but in each case the maximum contractile effect (the so-called maximal efficacy) is less than the maximum possible. These compounds have lower efficacy—a concept that Stephenson introduced—than the butyl, hexyl, and ethyl salts.
In 1910, the UK physiologist Archibald Vivian Hill gave a presentation to the Physiological Society, in which he analysed data on the haemoglobin–oxygen dissociation curve. The equation that he used was that of a rectangular hyperbola, which can be linearized as shown in Figure 2. The resulting plots are called Hill plots and the slope is called the Hill slope. In most cases the Hill slope is equal to one. When it is not, as in the case of the oxygen dissociation curve, it implies either that the ratio in which molecules of the ligand binds to molecules of its target is not one-to-one or that there is a phenomenon called cooperativity, in which the affinity of the ligand for its target changes as more and more molecules bind.
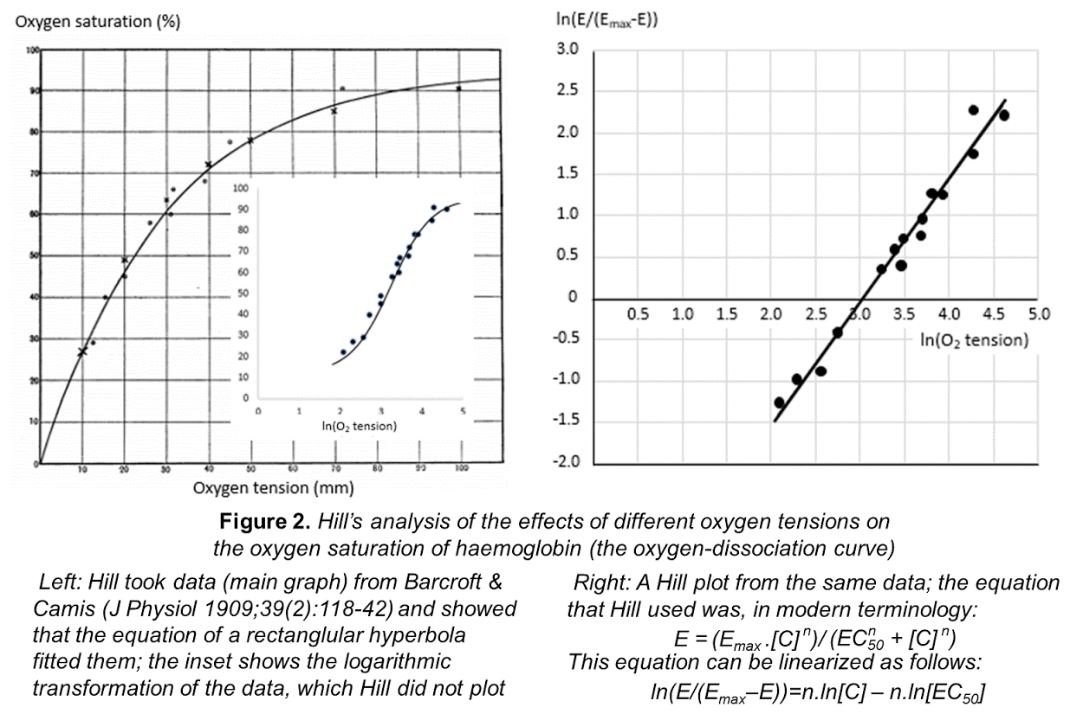
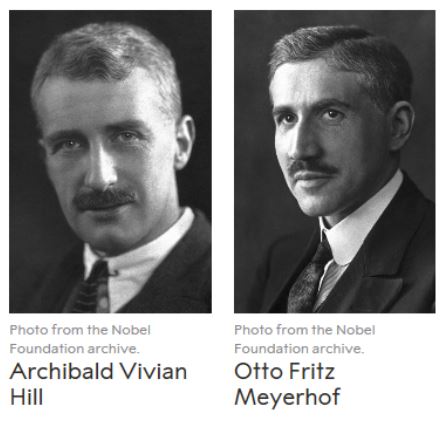
The Hill equation set the scene for modern interpretations of concentration-effect curves. Hill later won the Nobel prize, in 1922, “for his discovery relating to the production of heat in the muscle”, jointly with Otto Meyerhof, “for his discovery of the fixed relationship between the consumption of oxygen and the metabolism of lactic acid in the muscle”.
Analysing Stephenson’s curves using the Hill equation shows that they all have the same Hill slope of 1 (Figure 1), implying that one molecule of the compound interacts with one molecule of the effector responsible for contraction.
Stephenson’s data on the decyl trimethylammonium salt is a case apart. The salt has a biphasic effect on contraction of guinea-pig ileum: the extent of contraction increases at concentrations between 10-6 and 10-5 molar and then decreases at higher concentrations. This is the phenomenon known as hormesis, which I shall discuss next week.
Jeffrey Aronson is a clinical pharmacologist, working in the Centre for Evidence Based Medicine in Oxford’s Nuffield Department of Primary Care Health Sciences. He is also president emeritus of the British Pharmacological Society.
Competing interests: None declared.