 Last week I discussed the way in which the function ext can result in curves that go up or down with time, depending on whether x is greater or less than 1. It also depends on what you’re plotting. In the examples I gave I was plotting all new cases of an infection on any day, where the horizontal axis represented days.
But if instead of plotting new entries into the system, you’re plotting what’s left in the system as things disappear, you have to change the function slightly. Now it becomes e–xt. A good example is radioactive decay.
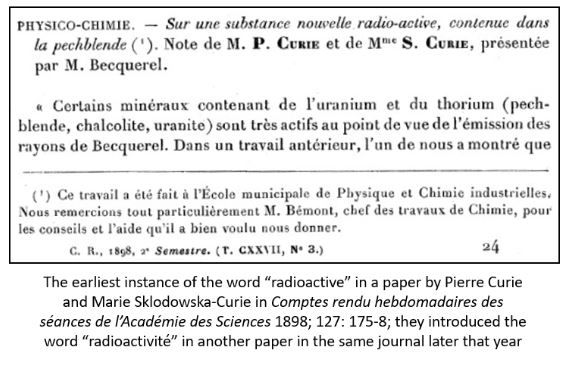
After the discovery of radioactivity by Henri Becquerel at the end of 1895, and invention of the words radioactive and radioactivity by Pierre Curie and his wife Marie Sklodowska-Curie in 1898, it was soon discovered that that radioactivity decayed.
The phenomenon of radioactive decay was observed by Ernest Rutherford and Frederick Soddy, who proposed that radioactivity was a process of spontaneous change of one element into another and modelled it mathematically as an exponential, according to what they called a law of radioactive change. Their method of calculation, which they described in a paper titled “Radioactive change” in The London, Edinburgh, and Dublin Philosophical Magazine and Journal of Science, is shown in the figure below.
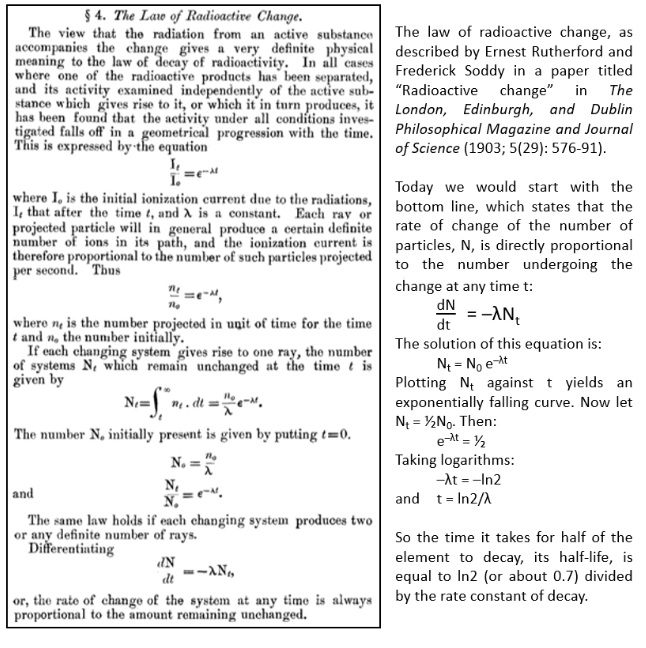
For any element, the value of λ, the rate constant of decay, which has units of reciprocal days (day–1), i.e. a fraction per day, is constant. And since it is related to the half-life of the element (the time it takes for half of the element to decay to another element) by the following equation: rate constant = ln2/half-life, the half-life for any element is also constant.
However, different radioactive elements decay at different rates, with a very wide range of values. Among naturally occurring radioactive elements the one with the shortest half-life, 23 yottoseconds (that’s 23 × 10–24 seconds) is hydrogen-7. And the one with the longest half-life, 2.2 yottayears (that’s 2.2 × 1024 years), is tellurium-128. Since this half-life is many trillion times the age of the universe, the estimated half-life of tellurium-128 comes with a health warning in the form of a confidence interval: 1.9–2.5 × 1024 years.
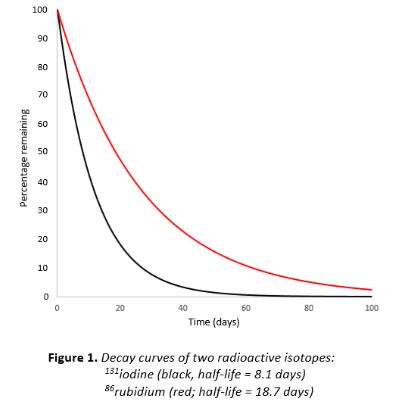
Figure 1 below shows the decay of two radioisotopes, 131iodine and 86rubidium.
This type of decay applies in other areas. For example the decay of a current in an electrical circuit is exponential and is described in exactly the same way as the decay of a radioactive isotope.
Similarly, the rate at which the amount of a drug in the body falls with time after administration is exponential. After one half-life 50% will be left in the body, after two half-lives 25%, after three half-lives 12.5% and so on. After 3.32 half-lives only 10% will be left. It is common therefore to say that most of the drug will have disappeared after four or five half-lives.
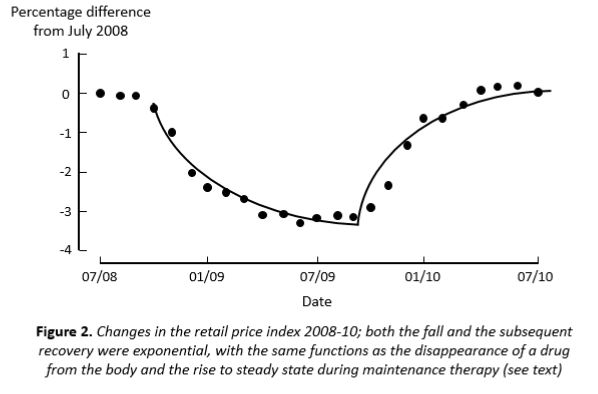
If you give a medicine at regular intervals it will accumulate in the body over a period of time, provided that the dose you are giving is more than the amount that is lost during the dosage interval. For example, if a drug has a half-life of 24 hours, I could give 2 mg on the first day (a loading dose) and then 1 mg daily thereafter (a maintenance dose), exactly replacing the previous day’s loss. But if I give more than 1 mg every day the amount of drug will increase day by day. Eventually, however, the rate of loss from the body will balance the daily dose and a steady state will ensue. If DL is the loading dose and DM is the maintenance dose at steady state, the amount lost during a dosage interval is the difference between the two and is also the amount lost by exponential decay. Thus, DL – DM = DL e–λt and therefore DM = DL(1 – e–λt).
This perhaps surprising result implies that the time it takes to reach this steady state also depends on the half-life of the drug in the body. You get halfway there in one half-life, 75% of the way in two half-lives, and so on. Hence it is common to say that a steady state is reached in 4–5 half-lives. Actually, that gets you about 94–97% of the way. Near enough steady state.
Here’s a graph of the changes in the retail price index during the banking crisis of 2008–9. I suspect that our economy is currently undergoing a similar change. And it’s exponential.
Jeffrey Aronson is a clinical pharmacologist, working in the Centre for Evidence Based Medicine in Oxford’s Nuffield Department of Primary Care Health Sciences. He is also president emeritus of the British Pharmacological Society.
Competing interests: None declared.