 This graphic was published last year with little fanfare. Recently it appeared on social media in patient circles, and was immediately met with dozens of shares, comments, tweets, and retweets:
• “Smart way to communicate chronic disease burden.”
• “One for clinicians to ponder if they think they understand the burden of Type 1 diabetes.”
• “One of the best depictions of why we do what we do.”
Why the surge in discussion? Because this time it was patients—the ultimate stakeholder—who saw it, and they said “Yes!” The social media discussion made clear that they have felt unheard in their struggles to carry out their self-care while managing life.
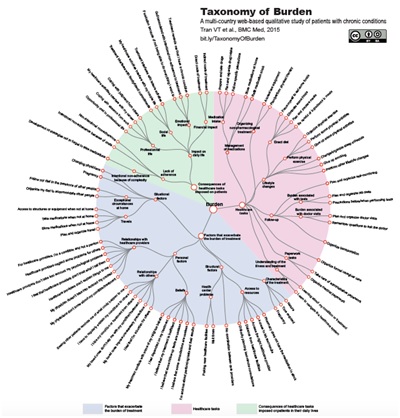
The graphic shows what Montori, Mair, and May have for years been calling the “burden of treatment”—an important and overlooked companion to the burden of disease—as they co-lead the International Workgroup for Minimally Disruptive Medicine. In most areas of life it’s taken for granted that success requires both parties in a partnership to work effectively, but in medicine this is often overlooked and rarely taught. Can this diagram help?
For years the Society for Participatory Medicine has said that medicine can only achieve its potential when both parties to the transaction—the patient and clinician—understand the nature of the work, which in reality is practical, not just biological. The patient comes with a problem, a need; the clinician brings training and experience, and gives recommendations for the work to be done, by each, to address the need.
Yet five years ago, in one of the earliest papers about burden of treatment, the authors said such discussions “usually arise during visits but rarely beget problem solving efforts.”
To foster such discussions, can printouts or posters of this graphic be posted in clinical visit rooms? I can imagine a clinician asking “Which of these things get in the way of our work, for you?”
Clinicians are trained to think about comorbidities, which complicate the management of individual conditions. Can we train them to think similarly about “co-tasking” or co-management, not just of their conditions per se but of all the other constraints on their time and energy? I would think that pharma companies, as well, would benefit from understanding what stands in the way of best use of their medications, which can help lead to development of drugs that are, in consumer terms, “ease of use.”
The beauty and power of this diagram is its “all at once”-ness. While the same facts might be written linearly in outline form, for easier reading one at a time, this visualization conveys the patient reality: you don’t get to process the burdens one at a time. They are concurrent.
Here’s hoping that this concise, compelling diagram can help patients, their clinicians, and policy makers manage conversations about clinical reality more realistically, to better create care plans that actually produce the intended result.
Victor Montori notes that the team that put the work of being a patient and burden of treatment on the map includes Kate Gallacher and Frances Mair from Glasgow and Carl May from Southampton UK.
Dave deBronkart is an activist for participatory medicine and a member of the BMJ Patient Panel.
Competing interests: None declared.
The graphic is from this article in BMC Medicine by Viet-Thi Tran, Caroline Barnes, Victor Montori, Bruno Falissard and Philippe Ravaud.