 Now you now know you continuous data can be Normal or not Normal (but we might be able to tweak that … see the next post) and we’d like to be able to describe it clearly and accurately.
We could just reproduce every bit, but we really want to compress it to get the meat & meaning across.
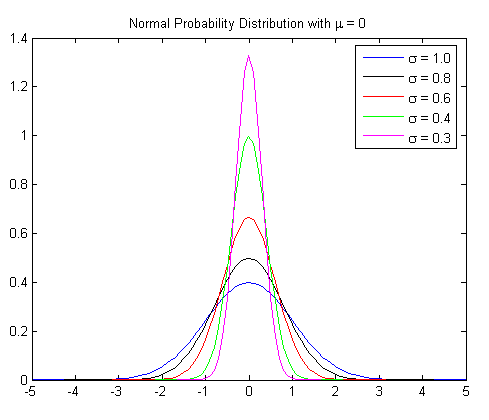
For Normal data we need just two values; where the centre of the curve is and how flattened out the bell is. These values are the mean (arithmetic average; greek mu: μ) and the standard deviation (the spread; greek sigma: σ).
Note well – this is standard DEVIATION not standard ERROR – we’ll get there another time.
EDIT: As pointed out by @DamianRoland, this might be a bit cryptic at first read. So here below is an interactive version of how mean and standard deviation affects the curve shape: The Normal Distribution from the Wolfram Demonstrations Project by Gary H. McClelland
For non-Normal data, we’re a bit more stuck. We still want to say the same stuff, but recognising that the mean & SD don’t cut the mustard. For these data, we still want to know where the centre is, so we tend to use the point where, if all lined up in size order, the middle value would fall. This is the median.
We also want to know it’s spread. So we may use the range: give the minimum and maximum. Or the interquartile range: the values in the size-order line where one quarter of the items (25%ile) , and three-quarters of them (75%ile) lie. Or as in the picture below, the 1st-9th decile spread.

In these simple ways we can give ‘a measure of central tendency’ (mean or median) and ‘an estimate of variability’ (SD or range-based figure) and let folk know what the data look like.
– Archi