 There are a host of things in the world that undergo transformations. These are often physical, emotional, psychological and spiritual. But numbers need love too, and we are getting to know that deep, deep down, we all love Normality.
The two curves below are clearly not Normal. They are heavily skewed, looking not like bells but battered teardrops or the smeary blobby bits on a marrow slide that haematologists claim to be able to diagnose leukaemia with.
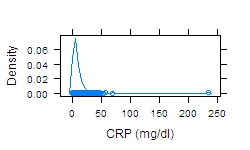
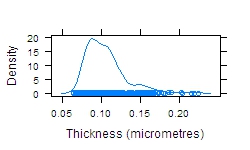
Transformation – doing a simple mathematical alteration of the numbers – can take these and make them beautiful.
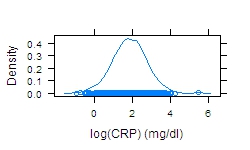
The first takes the natural logarithm of the number, to come up with the bell shape. This is known as a ‘log transformation’ and the (original) data are said to have a log-Normal distribution.
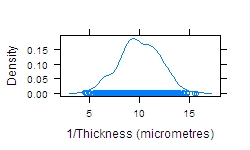
The second takes the reciprocal of the number, again to rectify the ugly shape. This too is a ‘transformation’
There are a few very simple transformations that could be examined to see if they make data Normal, and if so, you can use this more powerfully than nonNormal data in doing stats tests. So when you get nonNormal data, try these transformations and see if they make your numbers more lovable:
1/number-squared
1/number
1/square-root
log
square-root
square
You may well then feel transformed.
– Archi