While sugar sweetened beverages (SSBs) are increasingly being targeted by governments in their efforts to halt and reverse rising levels of obesity, energy drinks in particular have been singled out as a soft drink category that might constitute a double whammy for health. First of all, they contain high levels of both sugar and caffeine, as well as other substances; and secondly, these drinks are predominantly marketed to adolescents and young adults, for whom consumption of drinks that have the caffeine levels of up to two cups of coffee per serving are likely to be even more harmful than the “traditional” sugary soft drinks.
In a recent report for the Food Research Collaboration, Visram and Hashem review the evidence on energy drink consumption among children and adolescents, highlighting that, according to a 2011 EU survey, across Europe two thirds of adolescents report drinking energy drinks. The UK leads with the highest per capita consumption of 3.1 litres per month, compared to a European average of 2 litres.
We decided to look in more detail at trends for the UK, based on household level purchasing data on soft drinks (including carbonated soft drinks, juice drinks, squashes, energy drinks, and sports drinks—both sugary and diet versions) from Kantar Worldpanel for the years 2012-13, which covers purchases for at home consumption for approximately 31 000 households in the UK.
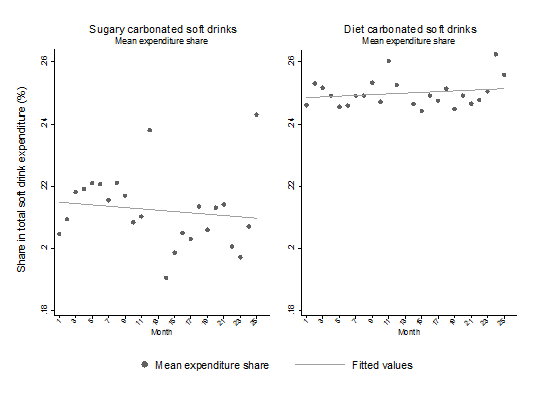
We found that, firstly, 61% of households never purchased any sugary energy drink and 90% never purchased any diet energy drink, so this category makes up less than 5% of total soft drink expenditure. This compares to an expenditure share of 22% for sugary carbonated soft drinks, and 25% for diet carbonated soft drinks. Among those households who do consume energy drinks, 8% of their soft drink expenditure share was on sugary energy drinks and 4% on diet energy drinks.
Secondly, households who consume sugary energy drinks purchased between 0.5 and 0.8 litres on average per month, with no clear time trend in purchasing patterns [Figure 1].
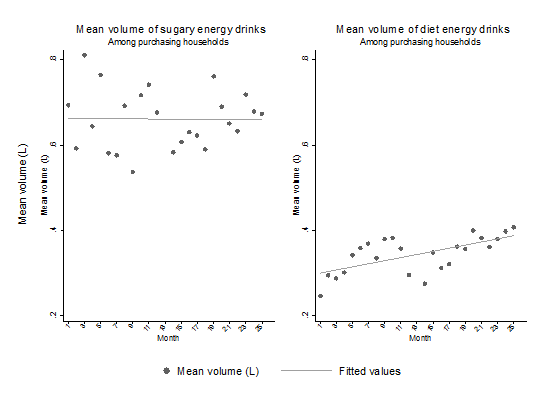
By contrast, purchases of diet energy drinks, while still constituting a small market, show a clear increasing trend across the period. This mirrors a more general trend of consumers increasing purchases of diet soft drinks [Figure 2].
However, one has to keep in mind that these data reflect at home consumption for the whole population rather than any particular subgroup, such as children and adolescents, and it may not cover all occasions when these drinks are purchased.
Nonetheless, there are two important points that arise from our brief analysis that are worth considering further. Firstly, although significant for those consuming them, our data suggest that overall the share of energy drinks in soft drink purchases remains very small, and should not distract from the core concern of sugar sweetened beverages in general. Secondly, while from a “sugar” perspective, the apparent move towards diet energy drinks could be a good sign, it is not clear that this type of substitution is positive given that concerns over the high caffeine levels (and other substances contained in energy drinks) remain.
This should give those advocating a tax levied on sugar sweetened beverages cause to consider for a moment what the indirect effect on health could be if such a price initiative moved consumers from regular, sugary soft drinks to diet—and especially diet energy drinks. If energy drinks are of concern independently of their sugar content, perhaps this suggests advocacy for an additional levy or differential rates for any type of energy drink.
* Note: For figures 1 and 2, the four week period around Christmas has been removed from the sample in both years as there are very strong spikes in purchases for at home consumption among all drink categories for this period. Soft drinks include: carbonated drinks, juice drinks, squashes, energy and sports drinks and exclude: fresh juices, milk based drinks, tea, coffee, water. Source: Kantar Worldpanel; author calculations.

Diana Quirmbach is a research fellow in health economics at the London School of Hygiene and Tropical Medicine. Her current work focuses on the direct and indirect impacts of diet related policies, such as food taxes and the regulation of portion sizes, on food and beverage consumption in the UK.

Laura Cornelsen is a lecturer and MRC fellow in economics of health at the London School of Hygiene and Tropical Medicine.

Richard Smith is professor of health system economics at the London School of Hygiene and Tropical Medicine.
Competing interests: We have read and understood BMJ policy on declaration of interests and declare the following interests: None.
Related articles: Energy drinks for children and adolescents