Xeroderma Pigmentosum (XP) is a genetic disease in which the system which repairs ultraviolet-induced damage is faulty. Patients develop eye and skin cancers from childhood and usually die in early adulthood. The main way to prevent the cancers and increase lifespan is extreme protection against ultraviolet in daylight, particularly for the face where the cancers mostly occur.
We recently invented a way of precisely measuring how much ultraviolet is reaching the skin on a person’s face over a period of several weeks. When we used it in XP patients, we found that some of them were not protecting their face well against ultraviolet. They were letting much ultraviolet reach the skin on the face, despite the risks.
In this study, we have looked for the reasons why these patients protect so much worse than other patients with the same disease. We looked at many characteristics of these patients and found 9 (out of the 29 we looked at) which were different in the patients who protected badly. The results suggest that these 9 characteristics may explain why these patients protect poorly. 7 of these 9 characteristics are psychological or social ones. They include a set of beliefs and perceptions about XP and about UV protection which are different in the poorly protecting patients. These types of characteristics are already known to contribute to difficulties for patients following treatment recommendations in some other diseases.
The practical value of this is that these psychological characteristics can be altered by the use of a correctly designed Behaviour Change Intervention. So we are moving on from this research to create an Intervention to improve this important UV protection in the group of XP patients who do not protect well. (https://jmg.bmj.com/content/early/2022/04/06/jmedgenet-2021-108323 )
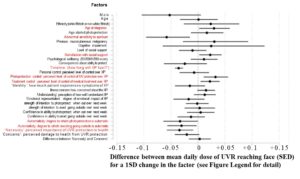
Figure: The X axis is the mean dose of ultraviolet reaching the face per day. From a technical point of view, the ‘bars’ are 95% confidence intervals for each of the factors on the Y axis, for the difference between the mean daily dose of UVR reaching the face (SED) for a 1SD change in the predictor variable for continuous variables (or change relative to reference group (e.g. ‘males’ versus ‘females’) for categorical variables).