I’m addicted to interactive visualisations of data, when they are well-made, informative and easy to use. One that I’ve returned to repeatedly is the “GBD 2010 Heat Map“, which ranks causes of deaths and DALY’s globally. The graph is based on the Global Burden of Diseases, Injuries and Risk factors Study, an impressive project that aspires to quantify mortality and morbidity globally. (Needless to say, the uncertainty intervals are wider for countries lacking comprehensive mortality registration… but it is especially for those settings that this project is invaluable!)
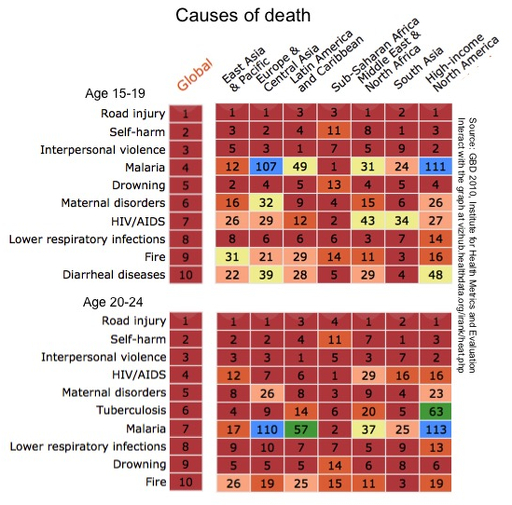
It’s a quite simple graph, but the beauty lies in how easy it is to shift between the measures, groups and countries/regions you are interested in. NB: The picture below is just a static image showing only the age groups I selected for this blog post, go to the live graph to explore other options than those shown here.
One thing that stands out very clearly in this graph is something we are already aware of: that injury prevention is an urgent issue among adolescents and young adults. Of the top ten causes of death worldwide in the ages 15-19 and ages 20-24, injuries rank as first (road injuries), second (self-inflicted), third (violence), fifth/ninth (drowning) and ninth/tenth (burns).
If we would change* the measure shown to YLD – years lived with disability – the main cause of morbidity for those aged 15-24 is depression; other mental health problems such as anxiety, conduct disorder and substance abuse are also among the top ten (see the graphs for ages 15-19 and ages 20-24 ).
These two issues – injuries and mental health – are not unrelated. Of course, mental health problems are strongly related to suicide and self-harm. But a recent article in Injury Prevention by McDonald, Sommers & Fargo also highlights the complex interrelations between mental health problems and risky driving, a complexity that seems particularly prominent among adolescents and young adults compared to adults. The article is based on a sample of youth and adults who are high-risk drivers, and shows, for the younger group, several significant pathways from depression and conduct behavior to various aspect of risky driving. (Similar results have been demonstrated earlier for example by our own Bridie Scott-Parker, a short report here in Injury prevention, and a path analysis in British Journal of Psychology.)
Thus, to some extent, mental health promotion and injury prevention need to go hand in hand, maybe especially among adolescents.
* In the live graph, select the measure you want by using controls in the top panel. Here you can also select age groups, male/female/total and countries/regions. Selecting regions can be a bit tricky, which I find to be the main drawback of this graph.