Part of a wish list for an endurance athlete would include a simple way to determine their suitable low intensity training zone. Since spending large amounts of time training at low intensity has been shown to have beneficial effects on cardiac remodeling, future endurance performance as well as allow proper recovery from high intensity efforts, knowing it’s boundary limit would be quite helpful.
Recently, a study (1) was published showing good agreement between the exercise intensity reached at the aerobic threshold (AT), an established boundary for low intensity training and a particular numeric value of a non-linear heart rate variability (HRV) index based on fractal correlation properties called DFA a1 (2). If we accept the premise of a specific value of DFA a1 as a marker of the AT, how can we make use of this property in day to day training? According to current data, as exercise intensity rises, DFA a1 declines from values of about 1.0 (fractal and well “correlated” patterns) during light exercise, passing .75 at the AT then further dropping to below .5 (“uncorrelated”, random patterns) well beyond the AT (3). As these values should be accurate over a wide athletic population, no prior calibration to gas exchange or lactate is required. A popular HRV software package like Kubios HRV can potentially provide information as to the time spent below or above the AT by analyzing the recorded beat-to-beat patterns from commonly worn heart rate monitor chest belts. However, real-time display of the DFA a1 during the exercise session has several potential benefits to an “after the fact” approach.
These include:
- Information about current absolute exercise intensity (is it above or below the AT) without prior formal lactate or gas exchange testing.
- Immediate assessment of the AT using either an exercise ramp or constant power intervals done by cycling or running.
- Avoiding post session data offload, processing and interpretation using Kubios HRV or similar software packages.
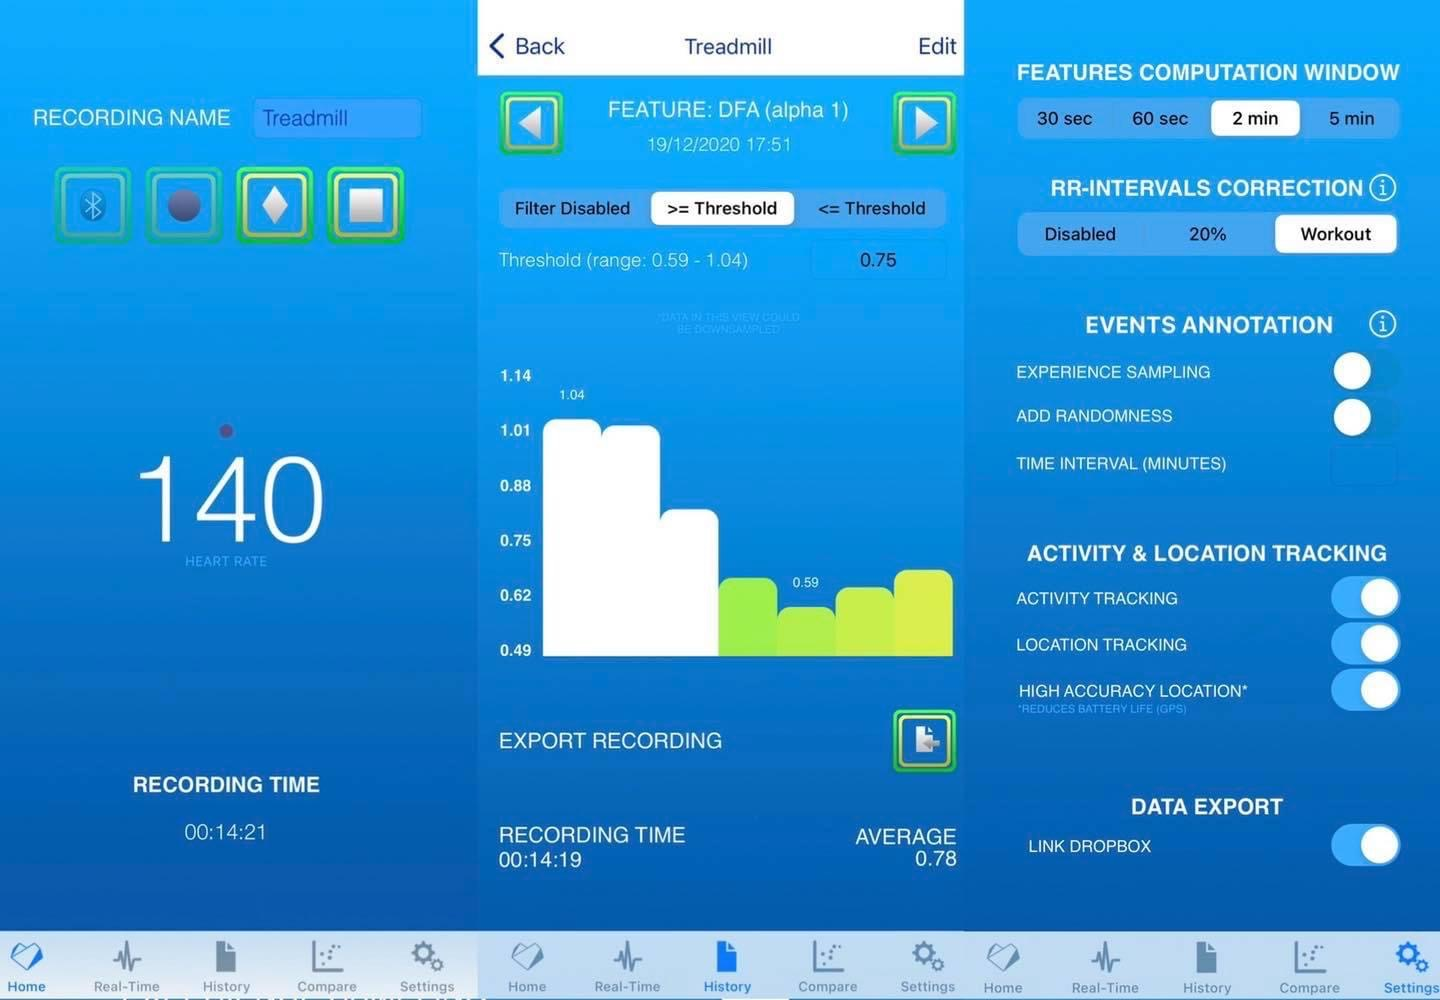
Until recently no mobile based product could display DFA a1 in real time using an off the shelf consumer device. However, at present an app designed for iOS devices, HRV Logger was revised using open source Python packages to display DFA a1 every 2 minutes on screen while recording from commonly used heart rate monitors. Although not originally intended as a dedicated DFA a1 monitoring system, the following examples (direct screenshots) will illustrate practical real-time estimation of the AT as well as monitoring intensity distribution.
USE IN FIELD PRACTICE: APP IMPLEMENTATION
Immediate estimation of AT in a cyclist with a documented AT of 205 watts by lactate testing
Using an indoor trainer controlled by a Zwift custom ramp (5 watts per minute, 130 to 230 watt span), the DFA a1 declined through the .75 range between a power of 200 and 210 watts, close to the lactate derived value. Real-time view of the session:
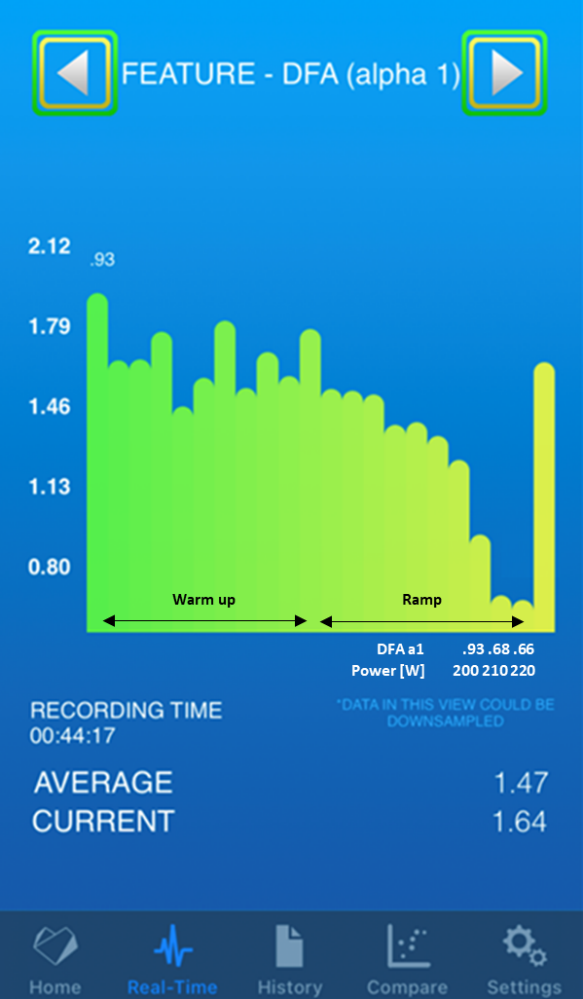
Test setup .gif with Zwift software on a screen and HRV Logger App on an iPad mini. This session consisted of 45 minutes of easy warm up, then 6 minutes at MLSS/LT2+15 watt (to get “uncorrelated” values of DFA a1 below .5), then easy cool down.
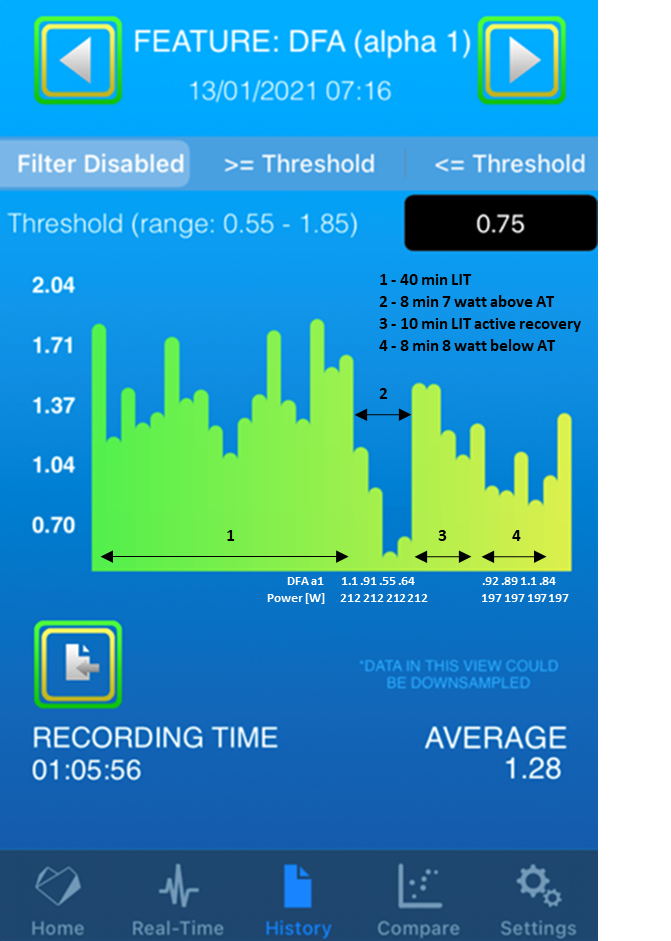
Immediate estimation of AT using constant power intervals and enforcement of low intensity training
On another occasion, the same cyclist as above displayed DFA a1 well above 1.0 during a 40 minute segment of low intensity training (40 watts below the AT). However, during the end of an 8 minute constant power interval performed just 7 watts above the AT (212 watts), DFA a1 declined past the .75 threshold. During an active recovery period over 10 minutes there was a rapid return of DFA a1 to fractal and well “correlated” values near 1.0. Finally, another 8 minute constant power interval done at 8 watts below the AT (197 watts) did not generate any value at .75 or above. History view of the session:
LIMITATIONS AND FUTURE DIRECTIONS
- Index behavior is well studied during running and cycling but no information in cross country skiing, swimming or rowing.
- Published validation was done using a high sample rate ECG. Results using consumer grade chest belts (e.g., Polar, Garmin, Suunto) with different R-peak detection methods and sampling rates are unclear.
- Little data available in females during endurance-typed exercise.
- Effects of missed beat artifact and arrhythmias unclear.
- No published comparisons of Kubios HRV vs Python script approaches. Preprocessing of data and artifact correction methods are different.
- HRV Logger application is not a dedicated app for DFA a1 during exercise. Limited graphics, artifact correction modes, no display of artifact percentage and only outputs DFA a1 every 2 minutes.
Recommended set up
- iPhone or iPad
- App settings: Window length 2 minutes, artifact correction in “workout mode”
- Recording device: Polar H series (H7, H10)
CONCLUSION
Real-time monitoring of DFA a1, a HRV index based on fractal correlation properties shows great potential for field assessment of the aerobic threshold using the iOS app, HRV Logger. In addition, since no external calibration is required, DFA a1 behavior during endurance-typed exercise can be used as a tool to specify intensity distribution at zone 1/zone 2 transition in a 3 zone model for the purpose of different training paradigms (e.g., polarized training).
Further information in addition to the references:
- Conference presentation “Can HRV be a key to zone training”: https://youtu.be/Wg7l8RKESn4
- Endurance innovation podcast “HRV estimation of aerobic threshold”: https://x3training.com/endurance-innovation-87-bruce-rogers-on-hrv-estimation-of-aerobic-threshold/
Authors and Affiliations:
Bruce Rogers1, Thomas Gronwald2
1College of Medicine, University of Central Florida, Orlando, FL, United States
2Department of Performance, Neuroscience, Therapy and Health, Faculty of Health Sciences, MSH Medical School Hamburg, Hamburg, Germany
No competing interests declared.
REFERENCES
- Rogers B, Giles D, Draper N, Hoos O, Gronwald T. A new detection method defining the aerobic threshold for endurance exercise and training prescription based on fractal correlation properties of heart rate variability. Front Physiol. 2021;11:596567. doi: 10.3389/fphys.2020.596567
- Gronwald T, Hoos O. Correlation properties of heart rate variability during endurance exercise: A systematic review. Ann Noninvasive Electrocardiol. 2020;25(1):e12697. doi: 10.1111/anec.12697
- Gronwald T, Rogers B, Hoos O. Fractal correlation properties of heart rate variability: A new biomarker for intensity distribution in endurance exercise and training prescription? Front Physiol. 2020;11:550572. doi: 10.3389/fphys.2020.550572