 Lumps and groups and clumps and factors … all sorts of ways of describing how Things Can Be Similar.
Cluster analysis is a statistical term that refers to an approach – not a particular method – that seeks to work out how to group items together so those in the same group are maximally similar to each other, and maximally different to things in other groups. Like cats and dogs.
This might look at minimising the distance on two axes, like this pretty picture: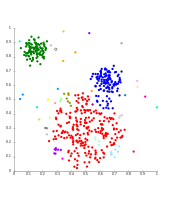
Or it might try and see how things group, and then sub-group, and then sub-sub-group, like this dendrogram:

(which might remind you of our recursive partitioning post)
The exact techniques are chosen with some common sense (what’s the grouping you think will be there), some computing power issues, and some fiddling (like most stats), and like most stats, if you pick a daft model you’ll get a daft answer. But the basic idea is simple: does this look more like Cluster 1 (dogs) or Cluster 2 (rabbits)

– Archi